Fletcher Building Limited (NZSE:FBU) Stock's Been Sliding But Fundamentals Look Decent: Will The Market Correct The Share Price In The Future?
Fletcher Building (NZSE:FBU) has had a rough three months with its share price down 15%. However, the company's fundamentals look pretty decent, and long-term financials are usually aligned with future market price movements. In this article, we decided to focus on Fletcher Building's ROE.
Return on equity or ROE is a key measure used to assess how efficiently a company's management is utilizing the company's capital. In other words, it is a profitability ratio which measures the rate of return on the capital provided by the company's shareholders.
See our latest analysis for Fletcher Building
How To Calculate Return On Equity?
The formula for return on equity is:
Return on Equity = Net Profit (from continuing operations) ÷ Shareholders' Equity
So, based on the above formula, the ROE for Fletcher Building is:
10% = NZ$368m ÷ NZ$3.6b (Based on the trailing twelve months to December 2022).
The 'return' is the amount earned after tax over the last twelve months. Another way to think of that is that for every NZ$1 worth of equity, the company was able to earn NZ$0.10 in profit.
What Has ROE Got To Do With Earnings Growth?
We have already established that ROE serves as an efficient profit-generating gauge for a company's future earnings. Based on how much of its profits the company chooses to reinvest or "retain", we are then able to evaluate a company's future ability to generate profits. Assuming everything else remains unchanged, the higher the ROE and profit retention, the higher the growth rate of a company compared to companies that don't necessarily bear these characteristics.
Fletcher Building's Earnings Growth And 10% ROE
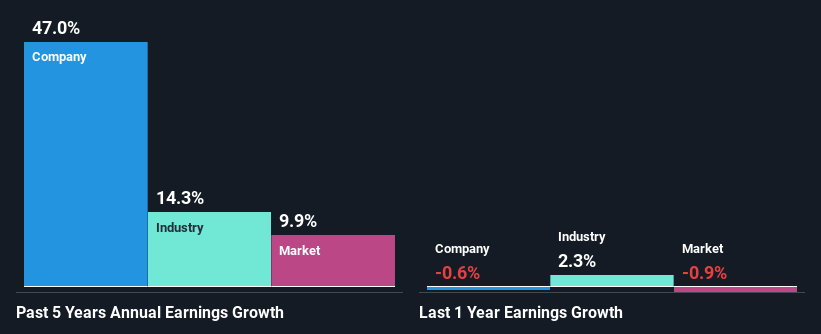
On the face of it, Fletcher Building's ROE is not much to talk about. Yet, a closer study shows that the company's ROE is similar to the industry average of 11%. Particularly, the exceptional 47% net income growth seen by Fletcher Building over the past five years is pretty remarkable. Considering the moderately low ROE, it is quite possible that there might be some other aspects that are positively influencing the company's earnings growth. For instance, the company has a low payout ratio or is being managed efficiently.
As a next step, we compared Fletcher Building's net income growth with the industry, and pleasingly, we found that the growth seen by the company is higher than the average industry growth of 14%.
Earnings growth is a huge factor in stock valuation. The investor should try to establish if the expected growth or decline in earnings, whichever the case may be, is priced in. This then helps them determine if the stock is placed for a bright or bleak future. Is FBU fairly valued? This infographic on the company's intrinsic value has everything you need to know.
Is Fletcher Building Using Its Retained Earnings Effectively?
Fletcher Building's significant three-year median payout ratio of 80% (where it is retaining only 20% of its income) suggests that the company has been able to achieve a high growth in earnings despite returning most of its income to shareholders.
Additionally, Fletcher Building has paid dividends over a period of at least ten years which means that the company is pretty serious about sharing its profits with shareholders. Our latest analyst data shows that the future payout ratio of the company over the next three years is expected to be approximately 67%. Therefore, the company's future ROE is also not expected to change by much with analysts predicting an ROE of 9.1%.
Summary
Overall, we feel that Fletcher Building certainly does have some positive factors to consider. Namely, its high earnings growth. We do however feel that the earnings growth number could have been even higher, had the company been reinvesting more of its earnings and paid out less dividends. With that said, on studying the latest analyst forecasts, we found that while the company has seen growth in its past earnings, analysts expect its future earnings to shrink. To know more about the latest analysts predictions for the company, check out this visualization of analyst forecasts for the company.
Have feedback on this article? Concerned about the content? Get in touch with us directly. Alternatively, email editorial-team (at) simplywallst.com.
This article by Simply Wall St is general in nature. We provide commentary based on historical data and analyst forecasts only using an unbiased methodology and our articles are not intended to be financial advice. It does not constitute a recommendation to buy or sell any stock, and does not take account of your objectives, or your financial situation. We aim to bring you long-term focused analysis driven by fundamental data. Note that our analysis may not factor in the latest price-sensitive company announcements or qualitative material. Simply Wall St has no position in any stocks mentioned.
Join A Paid User Research Session
You’ll receive a US$30 Amazon Gift card for 1 hour of your time while helping us build better investing tools for the individual investors like yourself. Sign up here
