Are Fletcher Building Limited's (NZSE:FBU) Fundamentals Good Enough to Warrant Buying Given The Stock's Recent Weakness?
With its stock down 22% over the past three months, it is easy to disregard Fletcher Building (NZSE:FBU). However, the company's fundamentals look pretty decent, and long-term financials are usually aligned with future market price movements. Particularly, we will be paying attention to Fletcher Building's ROE today.
Return on equity or ROE is a key measure used to assess how efficiently a company's management is utilizing the company's capital. Put another way, it reveals the company's success at turning shareholder investments into profits.
Check out our latest analysis for Fletcher Building
How To Calculate Return On Equity?
Return on equity can be calculated by using the formula:
Return on Equity = Net Profit (from continuing operations) ÷ Shareholders' Equity
So, based on the above formula, the ROE for Fletcher Building is:
6.9% = NZ$254m ÷ NZ$3.7b (Based on the trailing twelve months to June 2023).
The 'return' is the amount earned after tax over the last twelve months. That means that for every NZ$1 worth of shareholders' equity, the company generated NZ$0.07 in profit.
Why Is ROE Important For Earnings Growth?
Thus far, we have learned that ROE measures how efficiently a company is generating its profits. Based on how much of its profits the company chooses to reinvest or "retain", we are then able to evaluate a company's future ability to generate profits. Assuming everything else remains unchanged, the higher the ROE and profit retention, the higher the growth rate of a company compared to companies that don't necessarily bear these characteristics.
A Side By Side comparison of Fletcher Building's Earnings Growth And 6.9% ROE
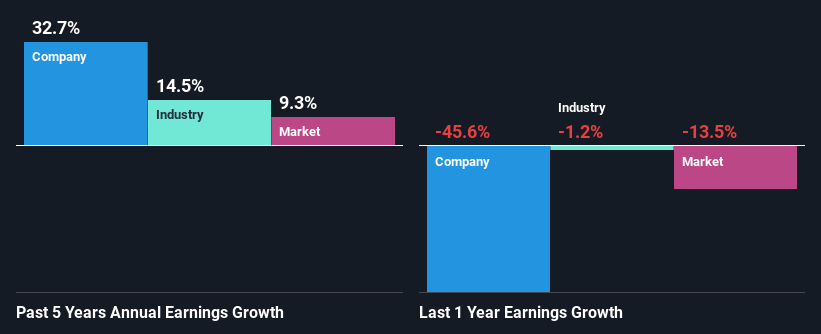
When you first look at it, Fletcher Building's ROE doesn't look that attractive. Next, when compared to the average industry ROE of 11%, the company's ROE leaves us feeling even less enthusiastic. In spite of this, Fletcher Building was able to grow its net income considerably, at a rate of 33% in the last five years. So, there might be other aspects that are positively influencing the company's earnings growth. Such as - high earnings retention or an efficient management in place.
Next, on comparing with the industry net income growth, we found that Fletcher Building's growth is quite high when compared to the industry average growth of 15% in the same period, which is great to see.
Earnings growth is a huge factor in stock valuation. It’s important for an investor to know whether the market has priced in the company's expected earnings growth (or decline). By doing so, they will have an idea if the stock is headed into clear blue waters or if swampy waters await. Has the market priced in the future outlook for FBU? You can find out in our latest intrinsic value infographic research report.
Is Fletcher Building Using Its Retained Earnings Effectively?
Fletcher Building's significant three-year median payout ratio of 82% (where it is retaining only 18% of its income) suggests that the company has been able to achieve a high growth in earnings despite returning most of its income to shareholders.
Moreover, Fletcher Building is determined to keep sharing its profits with shareholders which we infer from its long history of paying a dividend for at least ten years. Our latest analyst data shows that the future payout ratio of the company is expected to drop to 65% over the next three years. As a result, the expected drop in Fletcher Building's payout ratio explains the anticipated rise in the company's future ROE to 9.9%, over the same period.
Summary
On the whole, we do feel that Fletcher Building has some positive attributes. While no doubt its earnings growth is pretty substantial, we do feel that the reinvestment rate is pretty low, meaning, the earnings growth number could have been significantly higher had the company been retaining more of its profits. With that said, the latest industry analyst forecasts reveal that the company's earnings growth is expected to slow down. To know more about the latest analysts predictions for the company, check out this visualization of analyst forecasts for the company.
Have feedback on this article? Concerned about the content? Get in touch with us directly. Alternatively, email editorial-team (at) simplywallst.com.
This article by Simply Wall St is general in nature. We provide commentary based on historical data and analyst forecasts only using an unbiased methodology and our articles are not intended to be financial advice. It does not constitute a recommendation to buy or sell any stock, and does not take account of your objectives, or your financial situation. We aim to bring you long-term focused analysis driven by fundamental data. Note that our analysis may not factor in the latest price-sensitive company announcements or qualitative material. Simply Wall St has no position in any stocks mentioned.
