Some Fletcher Building (NZSE:FBU) Shareholders Are Down 50%

Many investors define successful investing as beating the market average over the long term. But the risk of stock picking is that you will likely buy under-performing companies. We regret to report that long term Fletcher Building Limited (NZSE:FBU) shareholders have had that experience, with the share price dropping 50% in three years, versus a market return of about 61%. The silver lining is that the stock is up 1.6% in about a week.
Check out our latest analysis for Fletcher Building
While markets are a powerful pricing mechanism, share prices reflect investor sentiment, not just underlying business performance. One flawed but reasonable way to assess how sentiment around a company has changed is to compare the earnings per share (EPS) with the share price.
Fletcher Building became profitable within the last five years. That would generally be considered a positive, so we are surprised to see the share price is down. So it's worth looking at other metrics to try to understand the share price move.
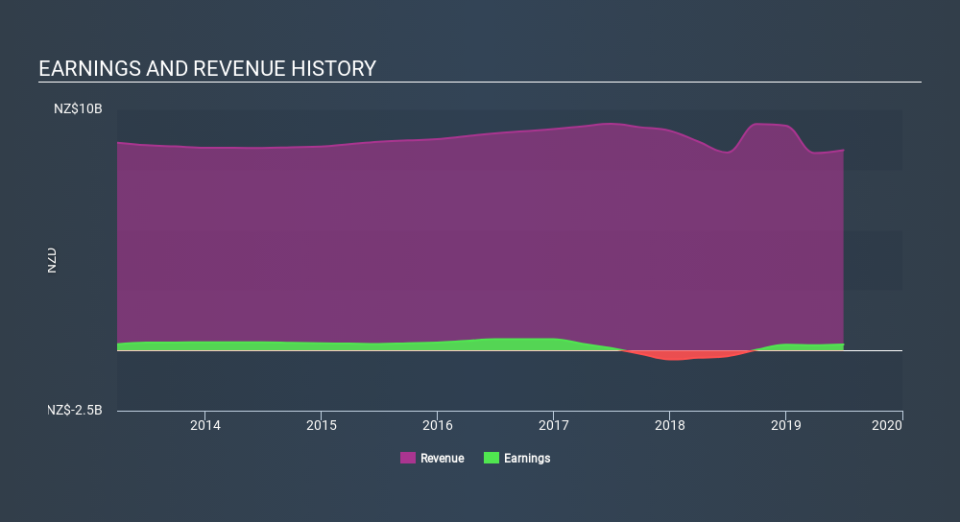
It's quite likely that the declining dividend has caused some investors to sell their shares, pushing the price lower in the process. In contrast it does not seem particularly likely that the revenue levels are a concern for investors.
The image below shows how earnings and revenue have tracked over time (if you click on the image you can see greater detail).
Fletcher Building is well known by investors, and plenty of clever analysts have tried to predict the future profit levels. If you are thinking of buying or selling Fletcher Building stock, you should check out this free report showing analyst consensus estimates for future profits.
What About Dividends?
It is important to consider the total shareholder return, as well as the share price return, for any given stock. The TSR is a return calculation that accounts for the value of cash dividends (assuming that any dividend received was reinvested) and the calculated value of any discounted capital raisings and spin-offs. So for companies that pay a generous dividend, the TSR is often a lot higher than the share price return. As it happens, Fletcher Building's TSR for the last 3 years was -41%, which exceeds the share price return mentioned earlier. This is largely a result of its dividend payments!
A Different Perspective
Fletcher Building shareholders gained a total return of 9.3% during the year. But that was short of the market average. But at least that's still a gain! Over five years the TSR has been a reduction of 4.4% per year, over five years. It could well be that the business is stabilizing. Keeping this in mind, a solid next step might be to take a look at Fletcher Building's dividend track record. This free interactive graph is a great place to start.
Of course, you might find a fantastic investment by looking elsewhere. So take a peek at this free list of companies we expect will grow earnings.
Please note, the market returns quoted in this article reflect the market weighted average returns of stocks that currently trade on NZ exchanges.
If you spot an error that warrants correction, please contact the editor at editorial-team@simplywallst.com. This article by Simply Wall St is general in nature. It does not constitute a recommendation to buy or sell any stock, and does not take account of your objectives, or your financial situation. Simply Wall St has no position in the stocks mentioned.
We aim to bring you long-term focused research analysis driven by fundamental data. Note that our analysis may not factor in the latest price-sensitive company announcements or qualitative material. Thank you for reading.
