FLEX Q2 Earnings Surpass Estimates, Revenues Decrease Y/Y
Flex Ltd FLEX reported second-quarter fiscal 2024 adjusted earnings per share (EPS) of 68 cents, beating the Zacks Consensus Estimate by 17.2%. The bottom line grew 7.9% year over year.
Revenues decreased 3.8% year over year to $7.47 billion. Also, it missed the consensus mark by 0.6%. The downtick was caused by weakness across the Agility Solutions segment.
Revenues for Core Flex (which represents Flex’s total revenues excluding Flex’s 51.47% economic interest in Nextracker) was $6.9 billion, declining 5.1% year over year.
Flex Ltd. Price, Consensus and EPS Surprise
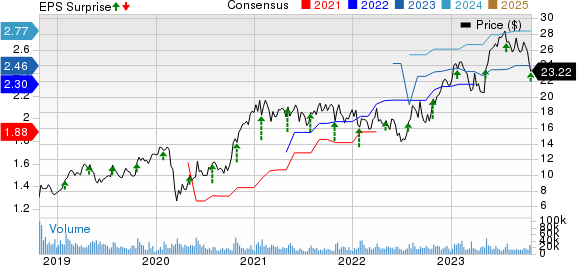
Flex Ltd. price-consensus-eps-surprise-chart | Flex Ltd. Quote
Segment Details
The Flex Reliability Solutions Group comprises Health Solutions, Automotive and Industrial businesses. Revenues were flat year over year to $3.3 billion. Demand remained healthy across the Auto and health business.
The Flex Agility Solutions Group comprises Communications & Enterprise Compute and Lifestyle and Consumer Devices businesses. Revenues were down 10% year over year to $3.6 billion. The downtick was caused due to the softness in comms, enterprise IT and consumer market.
The Nextracker Group’s revenues rose 21% year over year to $0.6 billion. The company has announced its plan to spin-off approximately 51.47% interest in Nextracker to Flex shareholders on a pro-rata basis. It is expected to be completed by the fourth quarter, which is ending on Mar 31, 2024.
Operating Details
Non-GAAP gross margin increased 130 basis points (bps) on a year-over-year basis to 9% in the reported quarter.
Non-GAAP selling, general & administrative expenses, as a percentage of revenues, were 3.2%, which increased 30 bps from the year-ago period.
Non-GAAP operating margin expanded 110 bps year over year to 5.9%.
Adjusted operating margins of the Flex Reliability Solutions Group was 5.2%, down 10 bps year over year. The Nextracker Group’s adjusted operating margin was 19.5%, up 1,040 bps year over year. The Flex Agility Solutions Group’s adjusted operating margin was 4.6%, up 30 bps.
Balance Sheet & Cash Flow
As of Sep 29, 2023, cash & cash equivalents totaled $2.9 billion compared with $2.66 billion as of Jun 30, 2023.
As of Sep 29, 2023, total debt (net of current portion) was $3.41 billion compared with $3.44 billion as of Jun 30, 2023.
In second-quarter fiscal 2024, the company generated cash flow from operating activities of $357 million and an adjusted free cash flow of $213 million.
In the quarter under review, FLEX repurchased shares worth $309 million.
Guidance
For third-quarter fiscal 2024, Total Flex (including Nextracker) revenues are expected to be between $6.5 billion and $6.9 billion. Management expects adjusted EPS in the range of 57-65 cents. Adjusted operating income is projected to be between $375 million and $425 million.
For third-quarter fiscal 2024, Core Flex (excluding Nextracker) revenues are expected to be between $5.9 billion and $6.3 billion. Management expects adjusted EPS in the range of 47-52 cents. Adjusted operating income is projected to be between $280 million and $310 million.
For fiscal 2024, Flex now expects total revenues between $28.1 billion and $28.8 billion compared with the earlier guidance of $30.5-$31.5 billion. It anticipates adjusted EPS in the range of $2.49-$2.66 compared with the earlier guidance of $2.35-$2.55. Adjusted operating margin is projected to be in the range of 5.8-6% compared with the earlier guidance of 5-5.2%.
Zacks Rank & Stocks to Consider
Flex currently carries a Zacks Rank #3 (Hold).
Some better-ranked stocks in the broader technology space are Asure Software ASUR, Synopsys SNPS and Wix.com WIX. Each stock presently sports a Zacks Rank #1 (Strong Buy). You can see the complete list of today’s Zacks #1 Rank stocks here.
The Zacks Consensus Estimate for Asure Software’s 2023 EPS has increased 5.9% in the past 60 days to 54 cents.
Asure Software’s earnings beat the Zacks Consensus Estimate in all the last four quarters, the average being 676.4%. Shares of ASUR have surged 55.9% in the past year.
The Zacks Consensus Estimate for Synopsys’ 2023 EPS has gained 2.5% in the past 60 days to $11.09. SNPS’ long-term earnings growth rate is 16.4%. Shares of SNPS have surged 62.7% in the past year.
The Zacks Consensus Estimate for Wix’s 2023 EPS has remained unchanged in the past 60 days to $3.35.
Wix’s earnings beat estimates in all the trailing four quarters, delivering an average surprise of 319.3%. Shares of WIX have rallied 5.3% in the past year.
Want the latest recommendations from Zacks Investment Research? Today, you can download 7 Best Stocks for the Next 30 Days. Click to get this free report
Flex Ltd. (FLEX) : Free Stock Analysis Report
Synopsys, Inc. (SNPS) : Free Stock Analysis Report
Asure Software Inc (ASUR) : Free Stock Analysis Report
Wix.com Ltd. (WIX) : Free Stock Analysis Report
