Flotek Industries (FTK): A Hidden Gem or a Value Trap?
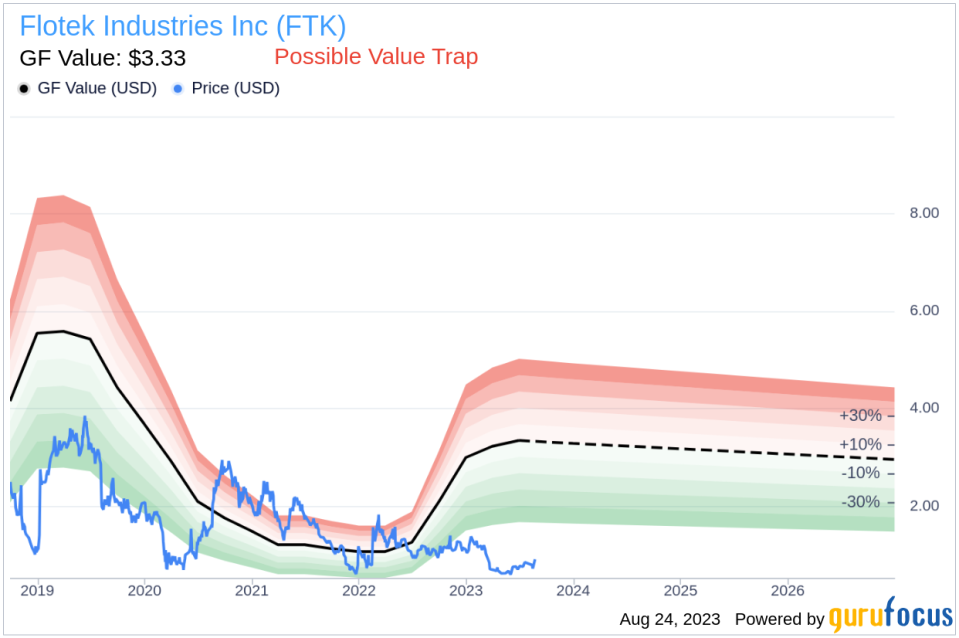
Value-focused investors are always on the hunt for stocks that are priced below their intrinsic value. One such stock that merits attention is Flotek Industries Inc (NYSE:FTK). The stock, which is currently priced at 0.92, recorded a gain of 19.56% in a day and a 3-month increase of 34.02%. The stock's fair valuation is $3.33, as indicated by its GF Value.
Understanding the GF Value
The GF Value represents the current intrinsic value of a stock derived from our exclusive method. The GF Value Line on our summary page gives an overview of the fair value that the stock should be traded at. It is calculated based on three factors:
1. Historical multiples (PE Ratio, PS Ratio, PB Ratio and Price-to-Free-Cash-Flow) that the stock has traded at.
2. GuruFocus adjustment factor based on the company's past returns and growth.
3. Future estimates of the business performance.
We believe the GF Value Line is the fair value that the stock should be traded at. The stock price will most likely fluctuate around the GF Value Line. If the stock price is significantly above the GF Value Line, it is overvalued and its future return is likely to be poor. On the other hand, if it is significantly below the GF Value Line, its future return will likely be higher.
Looking Beyond the Valuation
However, investors need to consider a more in-depth analysis before making an investment decision. Despite its seemingly attractive valuation, certain risk factors associated with Flotek Industries (NYSE:FTK) should not be ignored. These risks are primarily reflected through its low Altman Z-score of -0.54, and a Beneish M-Score of 1.51 that exceeds -1.78, the threshold for potential earnings manipulation. the company's revenues and earnings have been on a downward trend over the past five years, which raises a crucial question: Is Flotek Industries a hidden gem or a value trap? These indicators suggest that Flotek Industries, despite its apparent undervaluation, might be a potential value trap. This complexity underlines the importance of thorough due diligence in investment decision-making.
Decoding the Altman Z-score and Beneish M-Score
Before delving into the details, let's understand what the Altman Z-score entails. Invented by New York University Professor Edward I. Altman in 1968, the Z-Score is a financial model that predicts the probability of a company entering bankruptcy within a two-year time frame. The Altman Z-Score combines five different financial ratios, each weighted to create a final score. A score below 1.8 suggests a high likelihood of financial distress, while a score above 3 indicates a low risk.
Developed by Professor Messod Beneish, the Beneish M-Score is based on eight financial variables that reflect different aspects of a company's financial performance and position. These are Days Sales Outstanding (DSO), Gross Margin (GM), Total Long-term Assets Less Property, Plant and Equipment over Total Assets (TATA), change in Revenue (?REV), change in Depreciation and Amortization (?DA), change in Selling, General and Admin expenses (?SGA), change in Debt-to-Asset Ratio (?LVG), and Net Income Less Non-Operating Income and Cash Flow from Operations over Total Assets (?NOATA).
Company Snapshot: Flotek Industries Inc (NYSE:FTK)
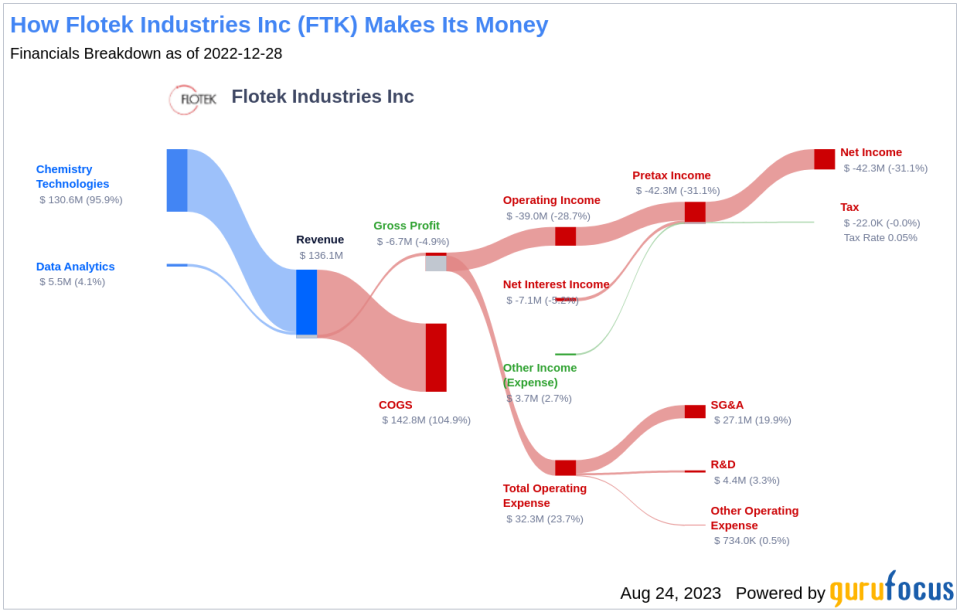
Flotek Industries Inc delivers chemistry-based technology solutions for energy, industrial, and consumer applications. It develops and supplies chemistry and services to the oil and gas industries, and high-value compounds to companies that make food and beverages, cleaning products, cosmetics, and others. The company operates in the Chemistry Technologies segment which designs, develops, manufactures, packages, and markets chemistries that market specialty chemicals. Its Data Analytics segment enables users to maximize the value of their hydrocarbon-associated processes by providing analytics associated with the streams in seconds rather than minutes or days.
This is the income breakdown of Flotek Industries:
Flotek Industries's Low Altman Z-Score: A Breakdown of Key Drivers
A dissection of Flotek Industries's Altman Z-score reveals Flotek Industries's financial health may be weak, suggesting possible financial distress. The Gross Margin index tracks the evolution of a company's gross profit as a proportion of its revenue. A downward trend could indicate issues such as overproduction or more generous credit terms, both of which are potential red flags for earnings manipulation. By examining the past three years of Flotek Industries's historical data (2021: -122.83; 2022: 4.57; 2023: 1.16), we find that its Gross Margin has contracted by 89.17%. Such a contraction in the gross margin can negatively impact the company's profitability as it signifies lesser income from each dollar of sales. This could put a strain on the company's capacity to manage operating costs, potentially undermining its financial stability.
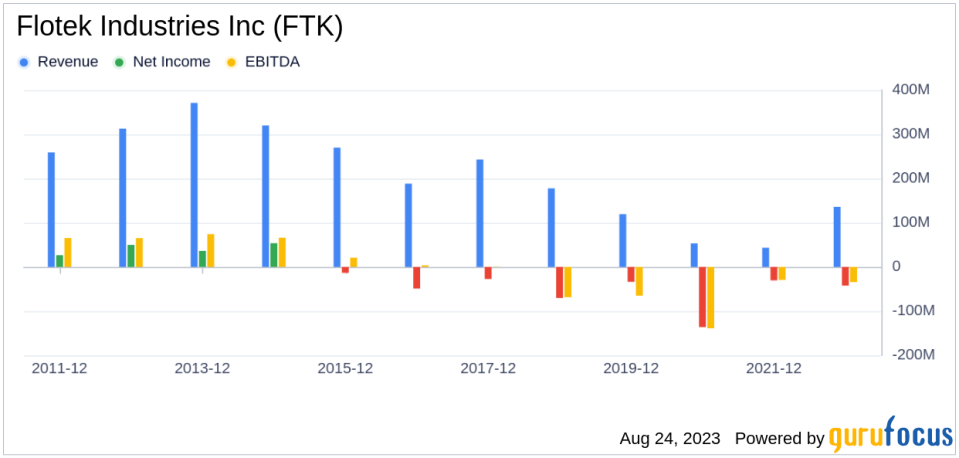
The Bearish Signs: Declining Revenues and Earnings
One of the telltale indicators of a company's potential trouble is a sustained decline in revenues. In the case of Flotek Industries, both the revenue per share (evident from the last five years' TTM data: 2019: 3; 2020: 1.16; 2021: 0.67; 2022: 0.69; 2023: 1.85; ) and the 5-year revenue growth rate (-25%) have been on a consistent downward trajectory. This pattern may point to underlying challenges such as diminishing demand for Flotek Industries's products, or escalating competition in its market sector. Either scenario can pose serious risks to the company's future performance, warranting a thorough analysis by investors.
Conclusion
Despite its low price-to-fair-value ratio, Flotek Industries's falling revenues and earnings cast a long shadow over its investment attractiveness. A low price relative to intrinsic value can indeed suggest an investment opportunity, but only if the company's fundamentals are sound or improving. In Flotek Industries's case, the declining revenues, EBITDA, and earnings growth suggest that the company's issues may be more than just cyclical fluctuations. Without a clear turnaround strategy, there's a risk that the company's performance could continue to deteriorate, leading to further price declines. In such a scenario, the low price-to-GF-Value ratio may be more indicative of a value trap than a value opportunity.
GuruFocus Premium members can find stocks with high Altman Z-Score using the following Screener: Walter Schloss Screen . To find out the high quality companies that may deliever above average returns, please check out GuruFocus High Quality Low Capex Screener. Investors can find stocks with good revenue and earnings growth using GuruFocus' Peter Lynch Growth with Low Valuation Screener.
This article first appeared on GuruFocus.
