Forex - Crude Oil at Top of Range as Natural Gas Threatens Blow Off
Main Points:
Weak US Dollar helps Crude Oil climb above $100 per barrel.
Natural Gas has fallen over range support, indicating a potential false breakout.
Warm weather over the next two weeks could hurt Natural Gas.
Energy markets were on fire the past several weeks. Inclement weather in Europe and North America has put a roadblock in front of the developed market economies, and now traders are second guessing the Federal Reserve’s best laid plans to taper QE3 little by little in 2014. Economic data out of the United States, the world’s largest economy, has been disappointing with only 75,000 jobs created in December and 113,000 jobs created in January.
Bad US economic data has knocked back the US Dollar, which has allowed commodities priced in dollars to appreciate in value. The precious metals complex is a good example in recent days. Energy markets were over the past three to four weeks. Despite further progress made by energy markets as Federal Reserve Chair Janet Yellen delivered her Congressional testimony on Tuesday, there has been little to no continuation. For both Crude Oil (CFD Ticker: USOIL) and Natural Gas (CFD Ticker: NGAS), price action couldn’t be weakening at a worse time.
Forex Analysis - Crude Oil Daily Chart

Trading since the second quarter of 2013 has resulted in a consolidation, with the more recent triangulation in price denoted on the chart with the red trendlines. Crude oil prices easily broke through the triangle resistance, but now faces potential parallel resistance. We have derived this expected level of resistance at $100.15, measured by taking the equal legs from the November 27, 2013 and January 9, 2014 lows, and drawing it to the December 27, 2013 high. This resistance is reinforced by two developments on the daily chart as a result of price action on Wednesday.
First, an inverted hammer formed, which is a single candle bearish reversal signal. The candle illustrates the psychology of the market during that specific period: bulls looked for continuation, but profit taking and/or new sellers ultimately closed price lower on the day. A new high at $101.36 was established, but there has yet to be a close above the last lower high in the sell off at $100.73. Adding to the bearish case is the “sell” signal issued by the Slow Stochastic indicator. The indicator remains in overbought territory, suggesting a strong market.
Therefore, with the uptrend remaining in place and the recent price action starting to look less bullish, it is possible that a breather unfolds. On any sell off, $98.70, a dynamic level of support and resistance in October, December, and January, would need to hold for bulls to remain confident in their chances at a more established crude oil breakout.
North American 8-14 Day Forecast: Temperature Probabilities
The rally in crude oil the past few days hasn’t been matched by excitement in natural gas. Even as the East Coast of the United States braces for another few days of inclement weather, natural gas has taken a turn away from its highs. The National Oceanic and Atmospheric Association (NOAA)’s 8-14 day forecast shows that above average temperatures are expected across the East Coast, including Chicago, New York City, and Washington, D.C., three of the hardest hit metropolitan and economic areas in the country.
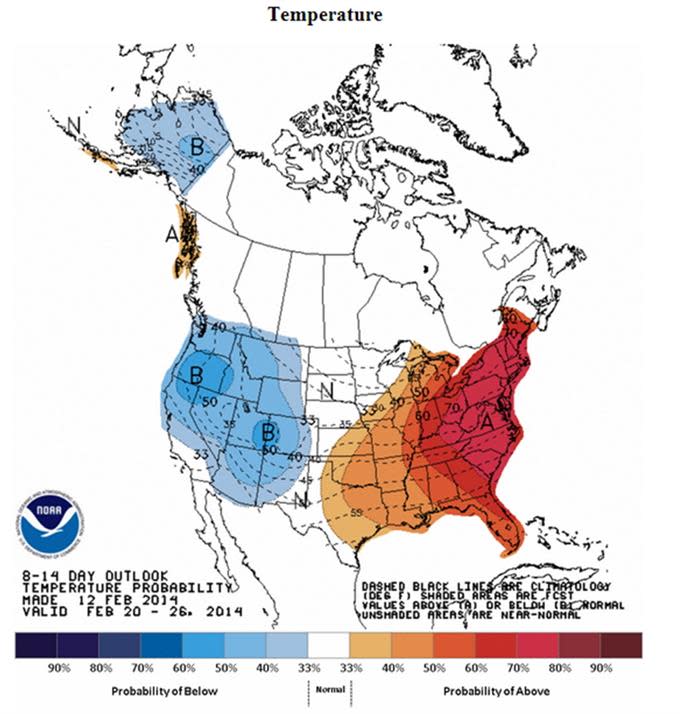
Warming temperatures means that demand for natural gas could fall. If demand for natural gas falls, price could pull back. Demand is the primary fundamental reason for NGAS strength in January: 241 billion cubic feet (bcf) were consumed, more than any month ever. January saw the coldest temperatures recorded ever across the northern parts of the country – a good reason to be buying heating oil!
The problem for natural gas now is two-fold. First, the fundamental reason for gas to rally may be waning now that temperatures are forecasted to rise. This may be provoking the second problem: the potential for a blow off top as the weekly chart below shows.
Forex - NGAS Weekly Chart

The weekly candle just over halfway through this week is more or less a Doji. But the developing weekly candle comes after a major reversal candle. The inverted hammer on the weekly chart was engulfing in nature. This has led to a “sell” signal on the Slow Stochastic indicator. The Slow Stochastic indicator has also recently put in a series of lower highs relative to higher highs in price, which is divergence.
Traders’ attention should be on $4.430, the former resistance which provoked a violent breakout. As price remains above the breakout level, breakout traders and trend traders alike may find interest in rebuying natural gas after a modest sell off. Therefore, until the former resistance turned support at $4.430 is broken, the weekly “sell” signal in the Slow Stochastic indicator is a better reference. Energy bulls may be forced to take a backseat in both crude oil and NGAS as they reverse recent gains.
DailyFX provides forex news and technical analysis on the trends that influence the global currency markets.
Learn forex trading with a free practice account and trading charts from FXCM.
