Forex: GBP/JPY Technical Analysis –Trend Line Resistance Broken
To receive Ilya's analysis directly via email, please SIGN UP HERE
Talking Points:
GBP/JPY Technical Strategy: Flat
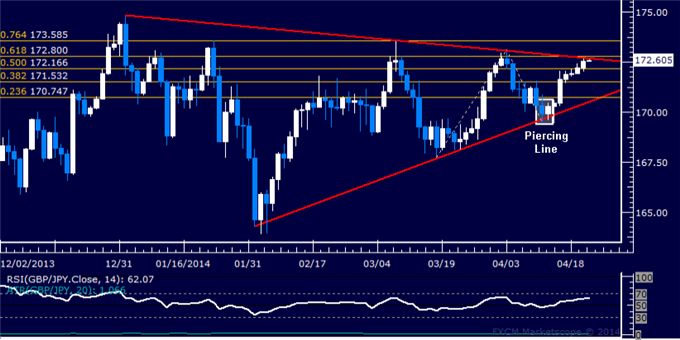
Support: 170.70 (23.6% Fib exp.), 168.81 (Mar 3 low)
Resistance: 171.87 (38.2% Fib exp.), 172.81 (50% Fib exp.)
The British Pound appears poised to continue to rise against the Japanese Yen after prices cleared resistance marked by a falling trend line set from January 2 and the 23.6% Fibonacci expansion. Buyers now aim to challenge the 38.2% Fib at 171.87, with a break above that targeting the 50% level at 172.81. Alternatively, a move back below the 23.6% expansion at 170.70 eyes the March 3 lowat 168.81.
A long position targeting 171.87 with a stop on a daily close below 170.70 can be justified from a risk/reward perspective assuming an entry price no higher than 171.28. We will pass on the opportunity however. The pair is highly correlated to the S&P 500 (0.73 on 20-day percent-change studies) and signs of vulnerability in the benchmark index’s positioning warn against betting on upside follow-through.
Confirm your chart-based trade setups with the Technical Analyzer. New to FX? Start Here!
Daily Chart - Created Using FXCM Marketscope 2.0
--- Written by Ilya Spivak, Currency Strategist for DailyFX.com
DailyFX provides forex news and technical analysis on the trends that influence the global currency markets.
Learn forex trading with a free practice account and trading charts from FXCM.
