Forex: GBP/JPY Technical Analysis – Flat-Lining Below 172.00
To receive Ilya's analysis directly via email, please SIGN UP HERE
Talking Points:
GBP/JPY Technical Strategy: Flat
Support: 169.28 (23.6% Fib exp.), 167.68 (38.2% Fib exp.)
Resistance: 171.31 (trend line), 173.63 (Jan 23 high)
Prices put in a Shooting Star candlestick below resistance at a trend line set from early January, warning the British Pound is losing bullish momentum and may be preparing to turn lower against the Japanese Yen. A break below the 23.6% Fibonacci expansion at 169.28 initially targets the 38.2% level at 167.68. Alternatively, a push above trend line resistance (now at 171.31) targets the January 23 high at 173.63.
Several back-to-back indecision candles reinforce the idea that previously established momentum has lost steam while flat-lining daily change readings warn a breakout may be near as volatility returns to more normal levels. Directional confirmation remains absent however and we will wait for a clear tipping of the scales to search out a trading opportunity.
Confirm your chart-based trade setups with the Technical Analyzer. New to FX? Start Here!
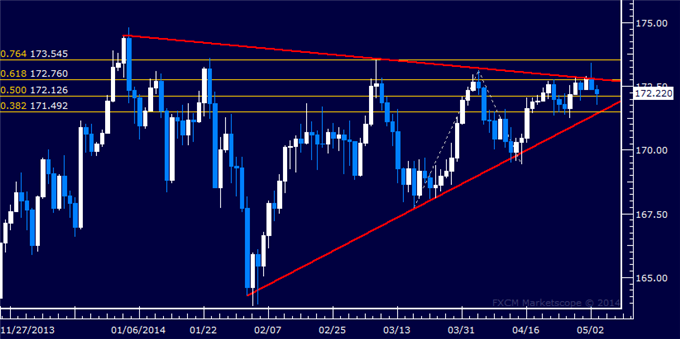
Daily Chart - Created Using FXCM Marketscope 2.0
--- Written by Ilya Spivak, Currency Strategist for DailyFX.com
DailyFX provides forex news and technical analysis on the trends that influence the global currency markets.
Learn forex trading with a free practice account and trading charts from FXCM.
