Forex: US Dollar Technical Analysis – Trend Line Back in Focus
To receive Ilya's analysis directly via email, please SIGN UP HERE
Talking Points:
US Dollar Technical Strategy: Holding Long via Mirror Trader Basket **
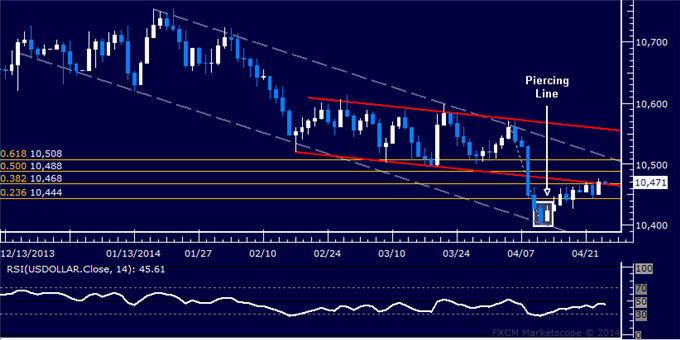
Support: 10568 (23.6% Fib ret.), 10545 (trend line from Sep’12), 10520 (Feb 17 low)
Resistance: 10598 (38.2% Fib ret.), 10623 (50% Fib ret.)
The Dow Jones FXCM US Dollar Index recoiled from resistance at 10598, the 38.2% Fibonacci retracement, with a close below the 23.6% level at 10568 putting the spotlight on a major trend line set from September 2012 (now at 10545). A further below that eyes the February 17 low at 10520. Alternatively, a reversal above 10598 targets the 50% retracement at 10623.
The greenback’s performance last week suggests the shift in the fundamental backdrop we discussed earlier may be materializing. We remain long the US Dollar via the Mirror Trader US Dollar currency basket. **
Daily Chart - Created Using FXCM Marketscope 2.0
** The Dow Jones FXCM US Dollar Index and the Mirror Trader USD basket are not the same product.
--- Written by Ilya Spivak, Currency Strategist for DailyFX.com
DailyFX provides forex news and technical analysis on the trends that influence the global currency markets.
Learn forex trading with a free practice account and trading charts from FXCM.
