Fresenius SE & Co. KGaA (ETR:FRE) Is Going Strong But Fundamentals Appear To Be Mixed : Is There A Clear Direction For The Stock?
Most readers would already be aware that Fresenius SE KGaA's (ETR:FRE) stock increased significantly by 20% over the past three months. However, we decided to pay attention to the company's fundamentals which don't appear to give a clear sign about the company's financial health. In this article, we decided to focus on Fresenius SE KGaA's ROE.
Return on equity or ROE is a key measure used to assess how efficiently a company's management is utilizing the company's capital. In short, ROE shows the profit each dollar generates with respect to its shareholder investments.
View our latest analysis for Fresenius SE KGaA
How Do You Calculate Return On Equity?
ROE can be calculated by using the formula:
Return on Equity = Net Profit (from continuing operations) ÷ Shareholders' Equity
So, based on the above formula, the ROE for Fresenius SE KGaA is:
5.0% = €1.6b ÷ €31b (Based on the trailing twelve months to June 2023).
The 'return' is the income the business earned over the last year. That means that for every €1 worth of shareholders' equity, the company generated €0.05 in profit.
What Has ROE Got To Do With Earnings Growth?
So far, we've learned that ROE is a measure of a company's profitability. Based on how much of its profits the company chooses to reinvest or "retain", we are then able to evaluate a company's future ability to generate profits. Assuming everything else remains unchanged, the higher the ROE and profit retention, the higher the growth rate of a company compared to companies that don't necessarily bear these characteristics.
Fresenius SE KGaA's Earnings Growth And 5.0% ROE
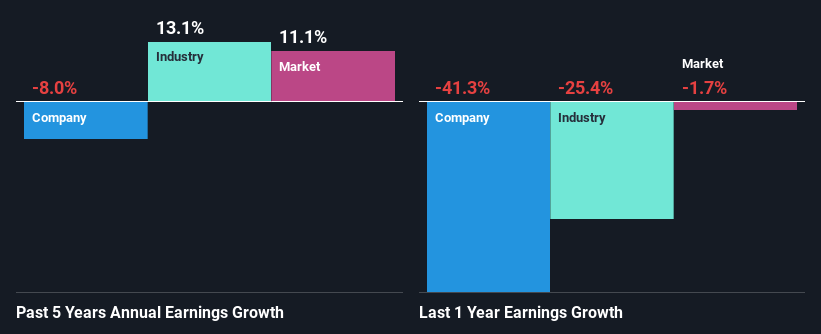
When you first look at it, Fresenius SE KGaA's ROE doesn't look that attractive. However, given that the company's ROE is similar to the average industry ROE of 5.5%, we may spare it some thought. But then again, Fresenius SE KGaA's five year net income shrunk at a rate of 8.0%. Bear in mind, the company does have a slightly low ROE. Therefore, the decline in earnings could also be the result of this.
So, as a next step, we compared Fresenius SE KGaA's performance against the industry and were disappointed to discover that while the company has been shrinking its earnings, the industry has been growing its earnings at a rate of 13% over the last few years.
The basis for attaching value to a company is, to a great extent, tied to its earnings growth. It’s important for an investor to know whether the market has priced in the company's expected earnings growth (or decline). This then helps them determine if the stock is placed for a bright or bleak future. Is Fresenius SE KGaA fairly valued compared to other companies? These 3 valuation measures might help you decide.
Is Fresenius SE KGaA Efficiently Re-investing Its Profits?
Despite having a normal three-year median payout ratio of 29% (where it is retaining 71% of its profits), Fresenius SE KGaA has seen a decline in earnings as we saw above. So there might be other factors at play here which could potentially be hampering growth. For example, the business has faced some headwinds.
Moreover, Fresenius SE KGaA has been paying dividends for at least ten years or more suggesting that management must have perceived that the shareholders prefer dividends over earnings growth. Our latest analyst data shows that the future payout ratio of the company over the next three years is expected to be approximately 31%. Regardless, the future ROE for Fresenius SE KGaA is predicted to rise to 9.1% despite there being not much change expected in its payout ratio.
Summary
In total, we're a bit ambivalent about Fresenius SE KGaA's performance. While the company does have a high rate of profit retention, its low rate of return is probably hampering its earnings growth. That being so, the latest industry analyst forecasts show that the analysts are expecting to see a huge improvement in the company's earnings growth rate. To know more about the latest analysts predictions for the company, check out this visualization of analyst forecasts for the company.
Have feedback on this article? Concerned about the content? Get in touch with us directly. Alternatively, email editorial-team (at) simplywallst.com.
This article by Simply Wall St is general in nature. We provide commentary based on historical data and analyst forecasts only using an unbiased methodology and our articles are not intended to be financial advice. It does not constitute a recommendation to buy or sell any stock, and does not take account of your objectives, or your financial situation. We aim to bring you long-term focused analysis driven by fundamental data. Note that our analysis may not factor in the latest price-sensitive company announcements or qualitative material. Simply Wall St has no position in any stocks mentioned.
