Do Fundamentals Have Any Role To Play In Driving Eumundi Group Limited's (ASX:EBG) Stock Up Recently?
Eumundi Group's (ASX:EBG) stock up by 2.6% over the past week. We wonder if and what role the company's financials play in that price change as a company's long-term fundamentals usually dictate market outcomes. Particularly, we will be paying attention to Eumundi Group's ROE today.
Return on equity or ROE is a key measure used to assess how efficiently a company's management is utilizing the company's capital. In simpler terms, it measures the profitability of a company in relation to shareholder's equity.
Check out our latest analysis for Eumundi Group
How To Calculate Return On Equity?
Return on equity can be calculated by using the formula:
Return on Equity = Net Profit (from continuing operations) ÷ Shareholders' Equity
So, based on the above formula, the ROE for Eumundi Group is:
0.8% = AU$526k ÷ AU$65m (Based on the trailing twelve months to December 2023).
The 'return' is the profit over the last twelve months. So, this means that for every A$1 of its shareholder's investments, the company generates a profit of A$0.01.
What Has ROE Got To Do With Earnings Growth?
We have already established that ROE serves as an efficient profit-generating gauge for a company's future earnings. Depending on how much of these profits the company reinvests or "retains", and how effectively it does so, we are then able to assess a company’s earnings growth potential. Assuming all else is equal, companies that have both a higher return on equity and higher profit retention are usually the ones that have a higher growth rate when compared to companies that don't have the same features.
Eumundi Group's Earnings Growth And 0.8% ROE
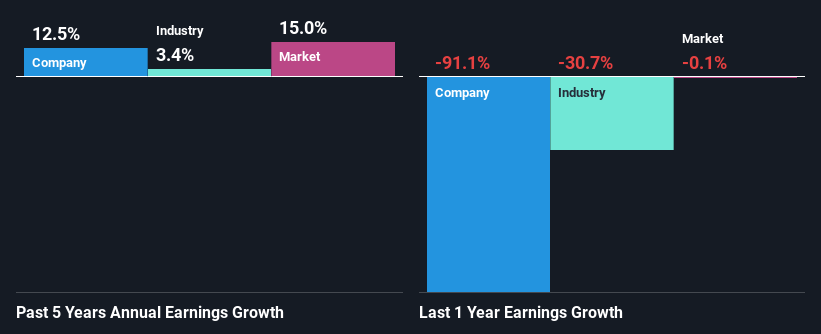
As you can see, Eumundi Group's ROE looks pretty weak. Even compared to the average industry ROE of 9.6%, the company's ROE is quite dismal. Although, we can see that Eumundi Group saw a modest net income growth of 12% over the past five years. We reckon that there could be other factors at play here. Such as - high earnings retention or an efficient management in place.
Next, on comparing with the industry net income growth, we found that Eumundi Group's growth is quite high when compared to the industry average growth of 3.4% in the same period, which is great to see.
The basis for attaching value to a company is, to a great extent, tied to its earnings growth. It’s important for an investor to know whether the market has priced in the company's expected earnings growth (or decline). This then helps them determine if the stock is placed for a bright or bleak future. If you're wondering about Eumundi Group's's valuation, check out this gauge of its price-to-earnings ratio, as compared to its industry.
Is Eumundi Group Efficiently Re-investing Its Profits?
Eumundi Group has a three-year median payout ratio of 44%, which implies that it retains the remaining 56% of its profits. This suggests that its dividend is well covered, and given the decent growth seen by the company, it looks like management is reinvesting its earnings efficiently.
Additionally, Eumundi Group has paid dividends over a period of nine years which means that the company is pretty serious about sharing its profits with shareholders.
Summary
In total, it does look like Eumundi Group has some positive aspects to its business. Even in spite of the low rate of return, the company has posted impressive earnings growth as a result of reinvesting heavily into its business. While we won't completely dismiss the company, what we would do, is try to ascertain how risky the business is to make a more informed decision around the company. You can see the 7 risks we have identified for Eumundi Group by visiting our risks dashboard for free on our platform here.
Have feedback on this article? Concerned about the content? Get in touch with us directly. Alternatively, email editorial-team (at) simplywallst.com.
This article by Simply Wall St is general in nature. We provide commentary based on historical data and analyst forecasts only using an unbiased methodology and our articles are not intended to be financial advice. It does not constitute a recommendation to buy or sell any stock, and does not take account of your objectives, or your financial situation. We aim to bring you long-term focused analysis driven by fundamental data. Note that our analysis may not factor in the latest price-sensitive company announcements or qualitative material. Simply Wall St has no position in any stocks mentioned.
