Do Fundamentals Have Any Role To Play In Driving FW Thorpe Plc's (LON:TFW) Stock Up Recently?
FW Thorpe's (LON:TFW) stock is up by 2.5% over the past month. As most would know, long-term fundamentals have a strong correlation with market price movements, so we decided to look at the company's key financial indicators today to determine if they have any role to play in the recent price movement. Particularly, we will be paying attention to FW Thorpe's ROE today.
ROE or return on equity is a useful tool to assess how effectively a company can generate returns on the investment it received from its shareholders. Put another way, it reveals the company's success at turning shareholder investments into profits.
See our latest analysis for FW Thorpe
How Do You Calculate Return On Equity?
The formula for ROE is:
Return on Equity = Net Profit (from continuing operations) ÷ Shareholders' Equity
So, based on the above formula, the ROE for FW Thorpe is:
14% = UK£22m ÷ UK£150m (Based on the trailing twelve months to December 2022).
The 'return' is the amount earned after tax over the last twelve months. So, this means that for every £1 of its shareholder's investments, the company generates a profit of £0.14.
Why Is ROE Important For Earnings Growth?
We have already established that ROE serves as an efficient profit-generating gauge for a company's future earnings. We now need to evaluate how much profit the company reinvests or "retains" for future growth which then gives us an idea about the growth potential of the company. Assuming all else is equal, companies that have both a higher return on equity and higher profit retention are usually the ones that have a higher growth rate when compared to companies that don't have the same features.
FW Thorpe's Earnings Growth And 14% ROE
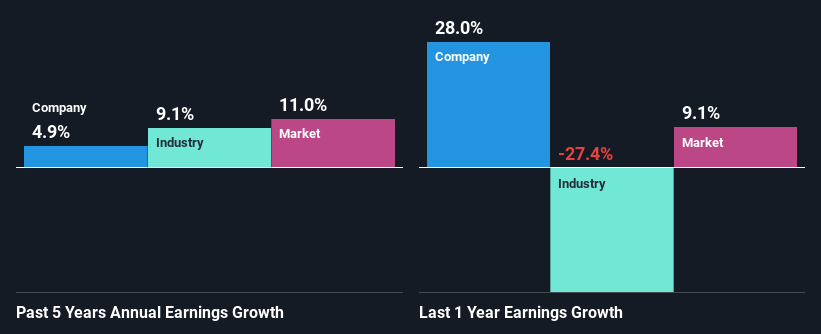
To begin with, FW Thorpe seems to have a respectable ROE. Further, the company's ROE compares quite favorably to the industry average of 11%. Despite this, FW Thorpe's five year net income growth was quite low averaging at only 4.9%. This is interesting as the high returns should mean that the company has the ability to generate high growth but for some reason, it hasn't been able to do so. We reckon that a low growth, when returns are quite high could be the result of certain circumstances like low earnings retention or poor allocation of capital.
As a next step, we compared FW Thorpe's net income growth with the industry and were disappointed to see that the company's growth is lower than the industry average growth of 9.1% in the same period.
Earnings growth is a huge factor in stock valuation. What investors need to determine next is if the expected earnings growth, or the lack of it, is already built into the share price. Doing so will help them establish if the stock's future looks promising or ominous. One good indicator of expected earnings growth is the P/E ratio which determines the price the market is willing to pay for a stock based on its earnings prospects. So, you may want to check if FW Thorpe is trading on a high P/E or a low P/E, relative to its industry.
Is FW Thorpe Making Efficient Use Of Its Profits?
Despite having a normal three-year median payout ratio of 43% (or a retention ratio of 57% over the past three years, FW Thorpe has seen very little growth in earnings as we saw above. So there might be other factors at play here which could potentially be hampering growth. For example, the business has faced some headwinds.
Moreover, FW Thorpe has been paying dividends for at least ten years or more suggesting that management must have perceived that the shareholders prefer dividends over earnings growth.
Summary
Overall, we feel that FW Thorpe certainly does have some positive factors to consider. However, given the high ROE and high profit retention, we would expect the company to be delivering strong earnings growth, but that isn't the case here. This suggests that there might be some external threat to the business, that's hampering its growth.
Have feedback on this article? Concerned about the content? Get in touch with us directly. Alternatively, email editorial-team (at) simplywallst.com.
This article by Simply Wall St is general in nature. We provide commentary based on historical data and analyst forecasts only using an unbiased methodology and our articles are not intended to be financial advice. It does not constitute a recommendation to buy or sell any stock, and does not take account of your objectives, or your financial situation. We aim to bring you long-term focused analysis driven by fundamental data. Note that our analysis may not factor in the latest price-sensitive company announcements or qualitative material. Simply Wall St has no position in any stocks mentioned.
Join A Paid User Research Session
You’ll receive a US$30 Amazon Gift card for 1 hour of your time while helping us build better investing tools for the individual investors like yourself. Sign up here
