FW Thorpe Plc's (LON:TFW) Stock On An Uptrend: Could Fundamentals Be Driving The Momentum?
FW Thorpe's (LON:TFW) stock is up by a considerable 16% over the past three months. Given that stock prices are usually aligned with a company's financial performance in the long-term, we decided to study its financial indicators more closely to see if they had a hand to play in the recent price move. Specifically, we decided to study FW Thorpe's ROE in this article.
Return on equity or ROE is a key measure used to assess how efficiently a company's management is utilizing the company's capital. Simply put, it is used to assess the profitability of a company in relation to its equity capital.
See our latest analysis for FW Thorpe
How To Calculate Return On Equity?
The formula for ROE is:
Return on Equity = Net Profit (from continuing operations) ÷ Shareholders' Equity
So, based on the above formula, the ROE for FW Thorpe is:
14% = UK£20m ÷ UK£145m (Based on the trailing twelve months to June 2022).
The 'return' is the income the business earned over the last year. Another way to think of that is that for every £1 worth of equity, the company was able to earn £0.14 in profit.
What Has ROE Got To Do With Earnings Growth?
So far, we've learned that ROE is a measure of a company's profitability. Based on how much of its profits the company chooses to reinvest or "retain", we are then able to evaluate a company's future ability to generate profits. Generally speaking, other things being equal, firms with a high return on equity and profit retention, have a higher growth rate than firms that don’t share these attributes.
FW Thorpe's Earnings Growth And 14% ROE
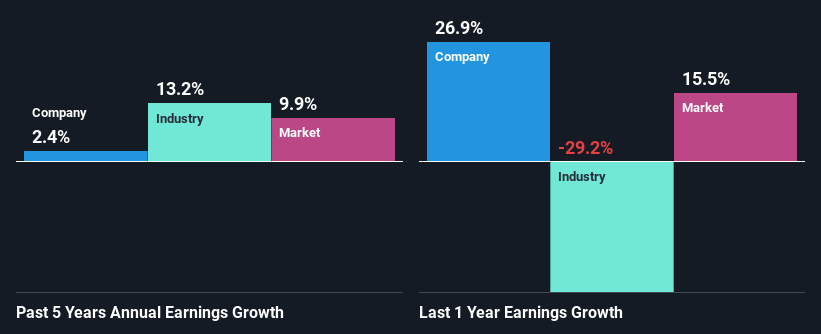
At first glance, FW Thorpe seems to have a decent ROE. And on comparing with the industry, we found that the the average industry ROE is similar at 14%. Despite the moderate return on equity, FW Thorpe has posted a net income growth of 2.4% over the past five years. So, there could be some other factors at play that could be impacting the company's growth. For instance, the company pays out a huge portion of its earnings as dividends, or is faced with competitive pressures.
As a next step, we compared FW Thorpe's net income growth with the industry and were disappointed to see that the company's growth is lower than the industry average growth of 13% in the same period.
Earnings growth is a huge factor in stock valuation. It’s important for an investor to know whether the market has priced in the company's expected earnings growth (or decline). This then helps them determine if the stock is placed for a bright or bleak future. Is FW Thorpe fairly valued compared to other companies? These 3 valuation measures might help you decide.
Is FW Thorpe Making Efficient Use Of Its Profits?
Despite having a normal three-year median payout ratio of 43% (or a retention ratio of 57% over the past three years, FW Thorpe has seen very little growth in earnings as we saw above. So there might be other factors at play here which could potentially be hampering growth. For example, the business has faced some headwinds.
Additionally, FW Thorpe has paid dividends over a period of at least ten years, which means that the company's management is determined to pay dividends even if it means little to no earnings growth.
Summary
On the whole, we do feel that FW Thorpe has some positive attributes. However, given the high ROE and high profit retention, we would expect the company to be delivering strong earnings growth, but that isn't the case here. This suggests that there might be some external threat to the business, that's hampering its growth. While we won't completely dismiss the company, what we would do, is try to ascertain how risky the business is to make a more informed decision around the company. To know the 1 risk we have identified for FW Thorpe visit our risks dashboard for free.
Have feedback on this article? Concerned about the content? Get in touch with us directly. Alternatively, email editorial-team (at) simplywallst.com.
This article by Simply Wall St is general in nature. We provide commentary based on historical data and analyst forecasts only using an unbiased methodology and our articles are not intended to be financial advice. It does not constitute a recommendation to buy or sell any stock, and does not take account of your objectives, or your financial situation. We aim to bring you long-term focused analysis driven by fundamental data. Note that our analysis may not factor in the latest price-sensitive company announcements or qualitative material. Simply Wall St has no position in any stocks mentioned.
Join A Paid User Research Session
You’ll receive a US$30 Amazon Gift card for 1 hour of your time while helping us build better investing tools for the individual investors like yourself. Sign up here
