Gap Inc's Dividend Analysis
Insights into Gap Inc's Dividend Sustainability and Growth
Gap Inc (NYSE:GPS) recently announced a dividend of $0.15 per share, payable on 2024-01-31, with the ex-dividend date set for 2024-01-02. As investors look forward to this upcoming payment, the spotlight also shines on the company's dividend history, yield, and growth rates. Using the data from GuruFocus, let's look into Gap Inc's dividend performance and assess its sustainability.
What Does Gap Inc Do?
This Powerful Chart Made Peter Lynch 29% A Year For 13 Years
How to calculate the intrinsic value of a stock?
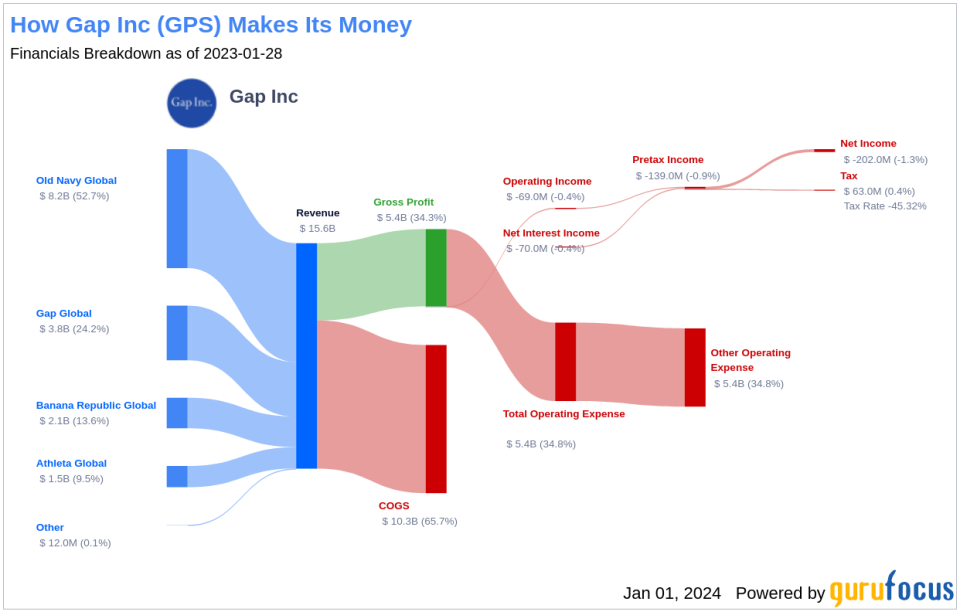
Gap retails apparel, accessories, and personal-care products under the Gap, Old Navy, Banana Republic, and Athleta brands. Old Navy generates more than half of Gap's sales. The firm also operates e-commerce sites, outlet stores, and specialty stores under various Gap names. Gap operates approximately 2,600 stores in North America, Europe, and Asia and franchises more than 900 stores in Asia, Europe, Latin America, and other regions. Gap was founded in 1969 and is based in San Francisco.
A Glimpse at Gap Inc's Dividend History
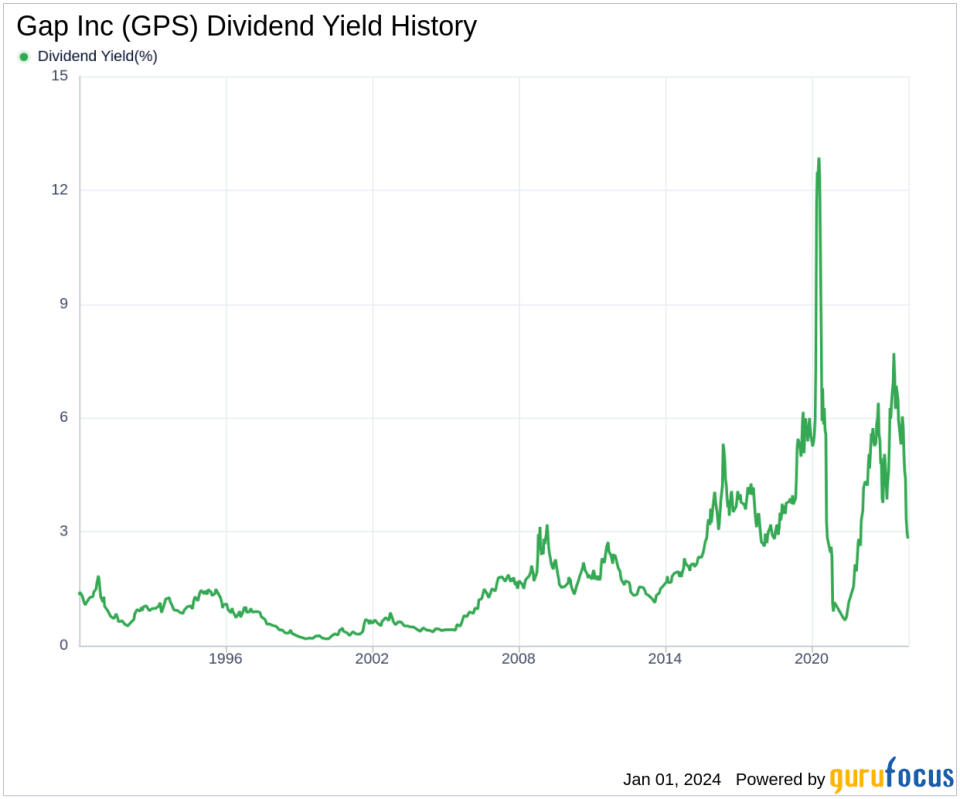
Gap Inc has maintained a consistent dividend payment record since 1985. Dividends are currently distributed on a quarterly basis. Below is a chart showing annual Dividends Per Share for tracking historical trends.
Breaking Down Gap Inc's Dividend Yield and Growth
As of today, Gap Inc currently has a 12-month trailing dividend yield of 2.87% and a 12-month forward dividend yield of 2.87%. This suggests an expectation of same dividend payments over the next 12 months. Over the past three years, Gap Inc's annual dividend growth rate was -14.80%. Based on Gap Inc's dividend yield and five-year growth rate, the 5-year yield on cost of Gap Inc stock as of today is approximately 2.85%.
The Sustainability Question: Payout Ratio and Profitability
To assess the sustainability of the dividend, one needs to evaluate the company's payout ratio. The dividend payout ratio provides insights into the portion of earnings the company distributes as dividends. A lower ratio suggests that the company retains a significant part of its earnings, thereby ensuring the availability of funds for future growth and unexpected downturns. As of 2023-10-31, Gap Inc's dividend payout ratio is 5.45, which may suggest that the company's dividend may not be sustainable. Gap Inc's profitability rank, offers an understanding of the company's earnings prowess relative to its peers. GuruFocus ranks Gap Inc's profitability 7 out of 10 as of 2023-10-31, suggesting good profitability prospects. The company has reported net profit in 8 years out of the past 10 years.
Growth Metrics: The Future Outlook
To ensure the sustainability of dividends, a company must have robust growth metrics. Gap Inc's growth rank of 7 out of 10 suggests that the company's growth trajectory is good relative to its competitors. Revenue is the lifeblood of any company, and Gap Inc's revenue per share, combined with the 3-year revenue growth rate, indicates a strong revenue model. Gap Inc's revenue has increased by approximately -0.60% per year on average, a rate that underperforms than approximately 64.07% of global competitors.
Next Steps
In conclusion, while Gap Inc's consistent dividend history and solid profitability rank provide some reassurance to investors, the negative dividend growth rate and underwhelming revenue performance pose questions about the future sustainability of its dividends. Investors should weigh Gap Inc's ability to maintain its dividend payments in light of its payout ratio, profitability, and growth metrics. As part of a balanced investment strategy, considering these factors will help investors make informed decisions about Gap Inc's place in their portfolios. GuruFocus Premium users can screen for high-dividend yield stocks using the High Dividend Yield Screener.
This article, generated by GuruFocus, is designed to provide general insights and is not tailored financial advice. Our commentary is rooted in historical data and analyst projections, utilizing an impartial methodology, and is not intended to serve as specific investment guidance. It does not formulate a recommendation to purchase or divest any stock and does not consider individual investment objectives or financial circumstances. Our objective is to deliver long-term, fundamental data-driven analysis. Be aware that our analysis might not incorporate the most recent, price-sensitive company announcements or qualitative information. GuruFocus holds no position in the stocks mentioned herein.
This article first appeared on GuruFocus.
