Gatos Silver Provides Updated Cerro Los Gatos Mineral Reserve, Mineral Resource, and Life of Mine Plan

Figure 1
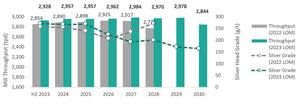
Figure 2
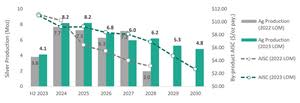
Figure 3
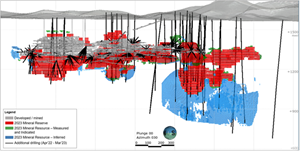
Figure 4

Figure 5
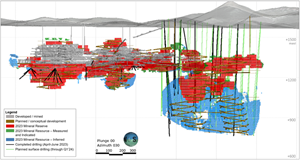
Figure 6
Mine Life Extended by 2.75 Years to the End of 2030 with 46% Increase in Total Silver Production
Significant Opportunities Available for Further Optimization, Growth and Mine Life Extension
VANCOUVER, British Columbia, Sept. 06, 2023 (GLOBE NEWSWIRE) -- Gatos Silver, Inc. (NYSE/TSX: GATO) (“Gatos Silver” or the “Company”) today reported an updated mineral reserve estimate (the “2023 Mineral Reserve”), mineral resource estimate (the “2023 Mineral Resource”) and life of mine (“LOM”) plan (the “2023 LOM Plan”, and together with the 2023 Mineral Reserve and 2023 Mineral Resource, the “2023 Updates”) for the Cerro Los Gatos Mine (“CLG”) with an effective date of July 1, 2023. The Company will host an investor and analyst call on September 7, 2023, details of which are provided below.
The Company has a 70% interest in the Los Gatos Joint Venture (“LGJV”), which in turn owns the CLG mine in Mexico. All dollar amounts are expressed in, and references to “$” refer to, United States dollars unless otherwise noted.
Dale Andres, CEO of Gatos Silver said: “We have achieved significant life extension objectives with this updated mineral reserve estimate, exceeding our target of adding one to two years. The new life of mine plan, which is based on recent operating performance, demonstrates our continued confidence in CLG’s ability to deliver robust margins and consistent cash flow. Gatos Silver has a strong balance sheet and remains debt free, with regular cash distributions to the joint venture partners expected throughout CLG’s mine life. We continue to believe there remains substantial additional value at CLG and we are now analyzing a number of projects with the potential to further improve margins and mine life as we move forward. In the near term, the LGJV is continuing to define the South-East Deeps area and ramp up exploration efforts in the Los Gatos district with the mobilization of a seventh surface drill rig this month.”
Summary
Robust CLG 2023 LOM Plan with strong and consistent annual cash flow profile (100% basis):
Mine life extended from early 2028 through to the end of 2030, an addition of 2.75 years
Average annual after-tax free cash flow1 of $75 million, resulting in an after-tax net present value (“NPV”)2 of $462 million, an increase of $123 million from the 2022 LOM from July 1, 2023 onwards
Sustaining capital costs of $160 million, a $93 million increase from the 2022 LOM to support the longer mine life including additional underground mine development and tailings storage capacity
Attractive by-product all-in sustaining costs (“AISC”)1 of $7.703 per ounce of payable silver
Total silver production over the remaining mine life expected to increase by 46% and total silver equivalent production4 expected to increase by 50%
Average annual production of 7.7 million ounces of silver expected during the 2024 to 2026 period
Average annual production over the LOM of 6.6 million ounces of silver, 65 million pounds of zinc and 47 million pounds of lead, or 12.4 million ounces of silver equivalent4 production
Additional drilling has delivered a significant increase to the 2023 Mineral Reserve:
2023 Mineral Reserve of 8.1 million tonnes at 217 g/t silver, 4.32% zinc, 2.20% lead, 0.25 g/t gold and 0.15% copper, with 56.3 million ounces of contained silver
61,520 additional metres of diamond drilling used in the block model estimation including 284 underground holes and 51 surface holes, an increase of 28%
1.8 million tonnes of the 2023 Mineral Reserve increase is in the South-East zone, inclusive of 328,000 tonnes below 1,100 metre elevation level in the South-East Deeps area
South-East Deeps discovery in 2022 has resulted in a significant increase to the 2023 Mineral Resource:
As first announced in October 2022, a deeper zone of mineralization, South-East Deeps, was discovered extending up to 415m below the 2022 Mineral Reserve
The first stage of drilling completed on the South-East Deeps zone (up until March 31, 2023) has resulted in an inferred resource estimate for CLG of 4.6 million tonnes at 100 g/t silver, 3.40% zinc, 2.32% lead, 0.21 g/t gold and 0.40% copper
2023 Mineral Resource includes 0.4 million tonnes of measured and indicated resource at 93 g/t silver, 3.55% zinc, 1.88% lead, 0.25 g/t gold and 0.14% copper
Substantial opportunities remain to increase mine life and further improve margins at CLG:
As previously announced, the infill drilling and exploration budget for 2023 was increased by $3 million to $16 million with a seventh surface drill rig being mobilized this month
Current drilling is focused on converting the higher-grade portions of the inferred resource in the South-East Deeps zone to measured and indicated resources, with a target of adding 3 to 4 years of mine life over the next 12 months
Increased drilling of near mine and district exploration targets planned during Q4-2023 and 2024
Capital efficient modifications to the existing plant are being evaluated in conjunction with further mine life extension efforts including; a pyrite leach circuit to increase silver and gold recovery, a copper separation circuit to produce copper concentrate and potential mill throughput growth up to 4,000 tpd
1 See Non-GAAP Financial Measures below.
2 NPV is as of July 1, 2023 using a 5% discount rate. NPV and free cash flow assume base case prices of $22/oz silver, $1.20/lb zinc, $0.90/lb lead, $1,700/oz gold, $3.50/lb copper and a Mexican Peso exchange rate of MXN 20.00 per US$1.00.
3 Includes LGJV management fee and administrative costs. Refer to Table 11 for AISC details.
4 Silver equivalent production is calculated using base case price assumptions to “convert” zinc, lead and gold production contained in concentrate to “equivalent” silver ounces (contained metal, multiplied by price, divided by silver price). Copper is excluded due to relatively low payable terms for copper in lead concentrate.
2023 CLG LOM Plan Update Summary
Table 1 presents a comparison of key metrics of the 2023 LOM Plan to the 2022 LOM Plan considering the comparable periods from July 1, 2023 onwards (the effective date of the 2023 LOM Plan).
Total silver production in the 2023 LOM Plan has increased by 46% compared with the 2022 LOM Plan, with slightly higher average mill throughput of 2,949 tpd and similar unit operating costs. Silver production averages 6.6 million ounces per year over the mine life and averages 7.7 million ounces during the 2024 to 2026 period. Figures 1 and 2 present annual mill throughput rates and silver head grades, and silver production and by-product AISC, respectively.
Table 1 – Summary of the 2023 LOM Plan and Comparison to the 2022 LOM Plan(1,2)
| 2023 LOM Plan | 2022 LOM Plan | Change | Change (%) |
Total Mill Throughput (Mt) | 8.08 | 5.03 | 3.05 | 61% |
Average Mill Throughput rate (tpd) | 2,949 | 2,900 | 49 | 2% |
Total Silver Production (Moz) | 49.7 | 34.1 | 15.6 | 46% |
Total Silver Equivalent Production (Moz) | 93.1 | 62.0 | 31.1 | 50% |
Average Silver Production (Moz / year)(1) | 6.6 | 7.2 | (0.5) | (8%) |
Average Zinc Production (Mlbs / year)(1) | 64.5 | 67.2 | (2.7) | (4%) |
Average Lead Production (Mlbs / year)(1) | 46.8 | 44.8 | 2.1 | 5% |
Average Silver Equivalent Production (Moz / year) | 12.4 | 13.1 | (0.6) | (5%) |
| ||||
Site Operating Costs ($ / tonne milled) | $88.67 | $88.95 | ($0.28) | 0% |
Sustaining Capital ($M) | $160.2 | $67.6 | $92.7 | 137% |
By-Product AISC ($/oz Ag pay.)(2) | $7.70 | $6.87 | $0.82 | 12% |
Co-Product AISC ($/oz AgEq pay.)(2) | $14.30 | $13.55 | $0.74 | 5% |
| ||||
Total Undiscounted Free Cash Flow ($M) | $547.5 | $381.2 | $166.3 | 44% |
Post-Tax NPV (5%, $M) | $461.7 | $338.6 | $123.1 | 36% |
(1) | Silver production is silver contained in Pb and Zn concentrates, zinc production is zinc contained in Zn concentrate, lead production is lead contained in Pb concentrate. |
(2) | By-product AISC and Co-product AISC include the LGJV management fee and administrative costs of $1.09 / oz Ag payable and $0.59 / oz AgEq payable, respectively in the 2023 LOM Plan and $0.89 / oz Ag payable and $0.50 AgEq payable, respectively in the 2022 LOM Plan from July 1, 2023. Refer to Table 11 for AISC details. |
|
|
Figure 1 – Mill Throughput and Silver Grade (2023 LOM Plan and 2022 LOM Plan)
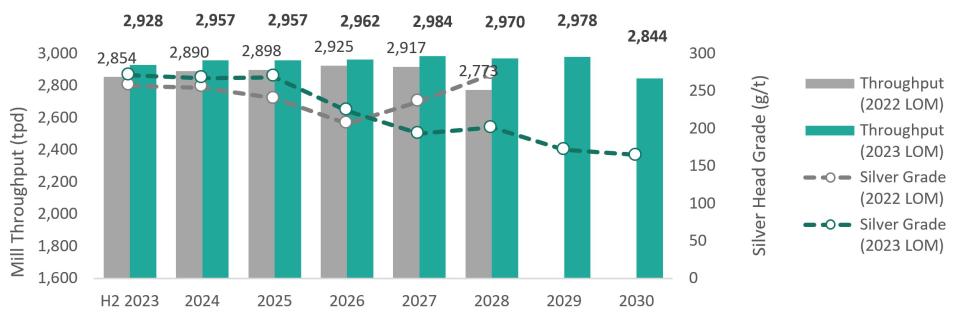
Figure 2 – Silver Production and By-Product AISC (2023 LOM Plan and 2022 LOM Plan)

2023 CLG Mineral Reserve and Mineral Resource Tables
The 2023 Mineral Reserve for CLG by reserve category is summarized in Table 2 and the CLG 2023 Mineral Resource reported by category is summarized in Table 3.
Table 2: 2023 CLG Mineral Reserve as at July 1 2023 (1,2,3,4,5,6,7,8,9,10)
|
| Ag | Zn | Pb | Au | Cu | Ag | Zn | Pb | Au | Cu |
Proven | 3.46 | 317 | 4.39 | 2.17 | 0.31 | 0.09 | 35.3 | 335.0 | 165.7 | 34.7 | 6.9 |
Probable | 4.62 | 141 | 4.27 | 2.23 | 0.20 | 0.19 | 21.0 | 435.3 | 226.6 | 29.3 | 19.5 |
Proven and Probable | 8.08 | 217 | 4.32 | 2.20 | 0.25 | 0.15 | 56.3 | 770.2 | 392.3 | 64.0 | 26.4 |
(1) | Mineral Reserves are reported on a 100% basis and exclude all mineral reserve material mined prior to July 1, 2023. |
(2) | Specific gravity has been assumed on a dry basis. |
(3) | Tonnage and contained metal have been rounded to reflect the accuracy of the estimate and numbers may not sum exactly. |
(4) | Values are inclusive of mining recovery and dilution. Values are determined as of delivery to the mill and therefore not inclusive of milling recoveries. |
(5) | Mineral Reserves are reported within stope shapes using a variable cut-off basis with a Ag price of US$22/oz, Zn price of US$1.20/lb, Pb price of US$0.90/lb, Au price of US$1,700/oz and Cu price of $3.50/lb. |
(6) | The Mineral Reserve is reported on a fully diluted basis defined by mining method, stope geometry and ground conditions. |
(7) | Contained Metal (CM) is calculated as follows: |
| • Zn, Pb and Cu, CM (Mlb) = Tonnage (Mt) * Grade (%) / 100 * 2204.6 |
| • Ag and Au, CM (Moz) = Tonnage (Mt) * Grade (g/t) / 31.1035 ; multiply Au CM (Moz) by 1000 to obtain Au CM (koz) |
(8) | The SEC definitions for Mineral Reserves in Regulation S-K 1300 were used for Mineral Reserve classification and are consistent with Canadian Institute of Mining, Metallurgy and Petroleum (CIM) Definition Standards for Mineral Resources and Mineral Reserves (CIM (2014) definitions). |
(9) | Under SEC Regulation S-K 1300, a Mineral Reserve is defined as an estimate of tonnage and grade or quality of indicated and measured mineral resources that, in the opinion of the qualified person, can be the basis of an economically viable project. More specifically, it is the economically mineable part of a measured or indicated mineral resource, which includes diluting materials and allowances for losses that may occur when the material is mined or extracted. |
(10) | The Mineral Reserve estimates were prepared under the supervision of Mr. Stephan Blaho, P.Eng. an employee of WSP Canada Inc. who is the independent Qualified Person for these Mineral Reserve estimates. |
|
|
Table 3: 2023 CLG Mineral Resource as at July 1 2023 (Exclusive of Mineral Reserves) (1,2,3,4,5,6,7,8,9,10,11)
| Mt | Ag | Zn | Pb | Au | Cu | Ag | Zn | Pb | Au | Cu | |||||||||||
Measured | 0.05 | 141 | 2.50 | 1.70 | 0.40 | 0.05 | 0.2 | 2.9 | 2.0 | 0.7 | 0.1 | |||||||||||
Indicated | 0.34 | 85 | 3.71 | 1.90 | 0.23 | 0.15 | 0.9 | 28.1 | 14.4 | 2.5 | 1.1 | |||||||||||
Measured and Indicated | 0.40 | 93 | 3.55 | 1.88 | 0.25 | 0.14 | 1.2 | 30.9 | 16.4 | 3.2 | 1.2 | |||||||||||
Inferred | 4.58 | 100 | 3.40 | 2.32 | 0.21 | 0.40 | 14.7 | 343.6 | 234.5 | 30.9 | 40.1 | |||||||||||
(1) | Mineral Resources are reported on a 100% basis and are exclusive of Mineral Reserves. |
(2) | The SEC definitions for Mineral Resources in S-K 1300 were used for Mineral Resource classification which are consistent with Canadian Institute of Mining, Metallurgy and Petroleum (CIM) Definition Standards for Mineral Resources and Mineral Reserves (CIM (2014) definitions). |
(3) | Under SEC Regulation S-K 1300, a Mineral resource is defined as a concentration or occurrence of material of economic interest in or on the Earth’s crust in such form, grade or quality, and quantity that there are reasonable prospects for economic extraction. A mineral resource is a reasonable estimate of mineralization, taking into account relevant factors such as cut-off grade, likely mining dimensions, location or continuity, that, with the assumed and justifiable technical and economic conditions, is likely to, in whole or in part, become economically extractable. It is not merely an inventory of all mineralization drilled or sampled. Mineral Resources which are not Mineral Reserves do not have demonstrated economic viability. The estimate of Mineral Resources may be materially affected by environmental, permitting, legal, marketing, or other relevant issues. |
(4) | The quantity and grade of reported Inferred Mineral Resources in this estimation are uncertain in nature and there has been insufficient exploration to define these Inferred Mineral Resources as an Indicated or Measured Mineral Resource. It is uncertain if further exploration will result in upgrading Inferred Mineral Resources to an Indicated or Measured Mineral Resource category. |
(5) | Specific gravity has been assumed on a dry basis. |
(6) | Tonnage and contained metal have been rounded to reflect the accuracy of the estimate and numbers may not sum exactly. |
(7) | Mineral Resources exclude all Mineral Resource material mined prior to July 1, 2023. |
(8) | Mineral Resources are reported within stope shapes using a $81.03/tonne Resource NSR cut-off calculated using an Ag price of $22/oz, Zn price of $1.20/lb, Pb price of $0.90/lb, Au price of $1,700/oz and Cu price of $3.50/lb. The Resource NSR cutoff includes mill recoveries and payable metal factors appropriate to the existing CLG processing circuit augmented with a pyrite leach circuit and copper separation circuit. The processing recoveries for these additional projects is based on existing preliminary metallurgical testwork. |
(9) | No dilution was applied to the Mineral Resource. |
(10) | Contained Metal (CM) is calculated as follows: |
| • Zn, Pb and Cu CM (Mlb) = Tonnage (Mt) * Grade (%) / 100 * 2204.6 |
| • Ag and Au, CM (Moz) = Tonnage (Mt) * Grade (g/t) / 31.1035; multiply Au CM (Moz) by 1000 to obtain Au CM (koz) |
(11) | The Mineral Resource estimates were prepared under the supervision of by Ronald Turner, MAusIMM(CP) an employee of Golder Associates S.A. who is the independent Qualified Person for these Mineral Resource estimates. |
|
|
Diamond Drilling
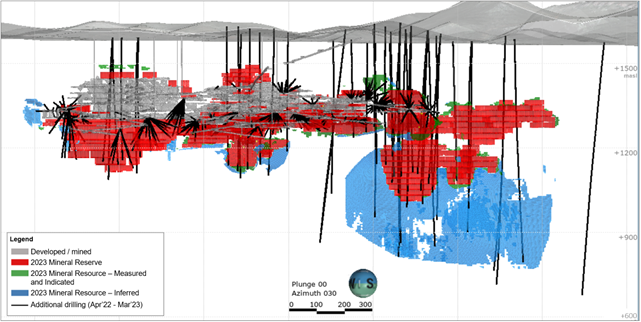
The increases in mineral reserve and mineral resource are primarily driven by a large amount of diamond drilling completed between the 2022 and 2023 updates. The 2023 Mineral Resource update for CLG used a total of 1,466 diamond drill holes totaling 282,905 metres. Compared to the 2022 mineral resource estimate, this represents a 28% increase from the database used for the 2022 update with an additional 32,057 metres of surface resource drilling from 51 holes and 29,462 metres of underground definition drilling from 284 holes as shown in Figure 3 below. The data cut-off date used for the 2023 Updates was the end of March 2023.
Various additional control measures are now in place that further strengthen the CLG drilling data collection process, including a new secure database system, additional quality assurance and quality control measures and periodic reporting, gyro downhole surveying for surface drill holes and increased diameter of the diamond core of the two smaller underground drill rigs from 35mm to 42mm.
Figure 3 – New Drilling Added between 2022 and 2023 Mineral Reserve Updates
Mineral Resource Estimation
The 2023 Mineral Resource uses an estimation methodology that is similar to the methodology used for the 2022 mineral resource estimate. Geological interpretation of 3D domain solids was completed using all available information including detailed underground mapping, channel sampling and surface and underground diamond drilling. The block model estimation uses assay information from diamond drill core only. The model interpolation is by multiple pass ordinary kriging using locally varying anisotropy to follow the changes in dip and azimuth of the veins. Control of outlier grades is by high grade distance restriction. The limits set for these restrictions are based on statistical analysis and comparison of mined areas to actual production. CLG mineral resources are reported exclusive of mineral reserves and within stope shapes to define reasonable prospects of economic extraction.
Changes since 2022 include the reduction in the sub-block size from 2.5m to 1.25m to better represent the vein solids and the addition of a fourth estimation pass with longer ranges that is used for estimation of inferred resource only.
2023 Mine Design and Scheduling
The methodology used to prepare the 2023 mine design is similar to the methodology that was implemented for the 2022 updates, only updated to account for changes in actual operating performance over the last 12 months.
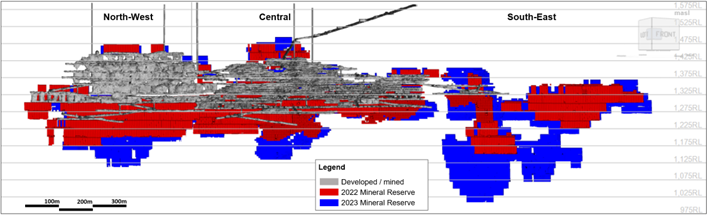
Long-hole (“LH”) mining methods were applied where amenable throughout the mine which represents approximately 74% of total LOM stope production. This compares to 56% LH tonnage in the 2022 mine design. Stope production in the mine plan transitions from approximately 50% LH in 2024 to 95% LH towards the end of the mine life. The increase in LH mining is a result of increased reserves coming from LH in the Central and South-East zones. The operation has successfully been mining steeper sections of the Central zone using LH mining methods. In addition, transverse LH mining is being used in certain areas in the Central zone that are dipping less than 55° but where the width of mineralization is greater than 8 metres. The mine design has been modified to reflect these operational changes. The majority of the South-East zone, where the largest reserve increase from drilling has occurred, also has a steeply dipping geometry suitable for LH mining. Other areas that are dipping less than 55° are still planned to be extracted using cut and fill (“C+F”) methods. See Figure 4 below for a comparison of the 2023 mine design versus the 2022 mine design.
Mineral reserve LH stopes are planned to be filled using primarily paste fill, with cemented rock fill or uncemented rock fill also considered in both the LH and C&F areas. The paste fill plant commenced operations at the end of 2022 and is performing in line with design specifications.
Mine dilution and mine recovery estimates are based on recent actual operating performance. These assumptions are applied based on the mining method, stope width, zone inclination and proximity to hanging-wall faults.
Operating and sustaining capital cost assumptions are based on recent actual costs with minor specific allowances for business improvement initiatives that are defined and being implemented. Mine operating costs were developed separately for LH and C+F mining methods.
Figure 4: Long Section of CLG 2023 and 2022 Mineral Reserve Solids
2023 LOM Production Plan
The 2023 LOM Plan is based on an average processing rate of 2,949 tonnes per day, resulting in a mine plan that exhausts current mineral reserves at the end of 2030. LOM mining rates are similar to current operating rates, and underground development for mining the current mineral reserve is expected to be materially complete in 2027.
Mineral processing at the current operation uses conventional sulphide flotation, producing separate lead and zinc concentrates. Predicted metallurgical recoveries over the 2023 LOM Plan average 88.2%, 62.8%, 89.4%, 54.2% and 60.0% for silver, zinc, lead, gold and copper, respectively. The recoveries were estimated based on recent actual plant performance. A total of 49.7 million ounces of silver, 484 million pounds of zinc, 351 million pounds of lead, 34.7 thousand ounces of gold and 11.8 million pounds of copper are estimated to be produced according to the 2023 LOM Plan.
Table 4: Life of Mine Projected Processing and Production Summary(1,2)
Plant Metrics | Units | H2 2023 | 2024 | 2025 | 2026 | 2027 | 2028 | 2029 | 2030 | LOM |
Processed Material | Mt | 0.54 | 1.08 | 1.08 | 1.08 | 1.09 | 1.09 | 1.09 | 1.04 | 8.08 |
Process Rate | tpd | 2,928 | 2,957 | 2,957 | 2,962 | 2,984 | 2,970 | 2,978 | 2,821 | 2,949 |
Ag Grade | g/t | 271 | 267 | 268 | 223 | 193 | 201 | 171 | 165 | 217 |
Zn Grade | % | 4.51 | 4.75 | 4.56 | 4.89 | 4.56 | 3.68 | 3.69 | 4.08 | 4.32 |
Pb Grade | % | 2.11 | 2.14 | 2.22 | 2.33 | 2.26 | 2.03 | 2.17 | 2.34 | 2.20 |
Au Grade | g/t | 0.28 | 0.27 | 0.28 | 0.26 | 0.27 | 0.24 | 0.19 | 0.21 | 0.25 |
Cu Grade | % | 0.10 | 0.10 | 0.11 | 0.12 | 0.14 | 0.21 | 0.24 | 0.15 | 0.15 |
Ag Production | Moz | 4.1 | 8.2 | 8.2 | 6.8 | 6.0 | 6.2 | 5.3 | 4.8 | 49.7 |
Zn Production | Mlbs | 33.6 | 71.1 | 68.1 | 73.1 | 68.6 | 55.3 | 55.5 | 58.6 | 484.0 |
Pb Production | Mlbs | 22.4 | 45.5 | 47.2 | 49.7 | 48.5 | 43.5 | 46.6 | 47.8 | 351.1 |
Au Production | koz | 2.6 | 5.0 | 5.3 | 4.8 | 5.0 | 4.5 | 3.7 | 3.7 | 34.7 |
Cu Production | Mlbs | - | - | 0.6 | 0.8 | 2.0 | 3.0 | 3.4 | 2.0 | 11.8 |
AgEq Production | Moz | 7.1 | 14.3 | 14.3 | 13.2 | 12.1 | 11.3 | 10.5 | 10.3 | 93.1 |
(1) | LOM begins on July 1, 2023. The 2023 Mineral Reserve excludes all mineral reserve material mined prior to July 1, 2023. |
(2) | Ag production is silver contained in Pb and Zn concentrates, Zn production is zinc contained in Zn concentrate, Pb production is lead contained in Pb concentrate, Au production is gold contained in Pb concentrate and Cu production is copper contained in Pb concentrate when Cu is expected to be above the payable threshold. |
|
|
CLG’s short term definition drilling and short term mine plan updates required for execution may cause actual annual operating results to differ significantly from the 2023 LOM Plan schedule shown in Table 4. Gatos Silver provides annual production guidance and quarterly production results for CLG, and such results can vary quarter over quarter based on short term execution plans and constraints. Annual guidance for 2024 is expected to be announced in early 2024 after detailed planning and budgeting for the year is complete. The Company cautions investors that guidance might differ from the 2023 LOM Plan, and actual results might significantly differ from guidance.
2023 LOM Cash Flows
Table 5 presents a summary of 2023 LOM Plan cash flows. In the 2023 LOM Plan, silver accounts for 54% of the total payable metal value, with zinc, lead, gold and copper representing 27%, 16%, 2% and 1%, respectively.
Table 5: Summary of 2023 LOM Plan Free Cash Flow
| Units | H2 2023 | 2024 | 2025 | 2026 | 2027 | 2028 | 2029 | 2030 | 2031+ | LOM |
Pre-tax Free Cash Flow | $M | 44.6 | 101.7 | 101.5 | 90.9 | 81.5 | 91.4 | 89.0 | 91.0 | (14.8) | 676.7 |
After-tax Free Cash Flow | $M | 39.1 | 75.7 | 76.3 | 69.8 | 67.4 | 81.4 | 75.6 | 77.0 | (14.8) | 547.5 |
Table 6 presents a sensitivity of 2023 LOM Plan economic results to silver prices.
Table 6: Summary of 2023 LOM Plan Economic Results at Various Silver Prices
Silver Price |
| $20/oz | 2023 LOM | $24/oz | $26/oz |
Total LOM Free Cash Flow | $M pre-tax | 586.8 | 676.7 | 766.6 | 856.5 |
$M post-tax | 482.8 | 547.5 | 612.2 | 676.9 | |
Net Present Value | $M pre-tax | 495.6 | 572.4 | 649.2 | 726.0 |
$M post-tax | 406.0 | 461.7 | 517.5 | 573.3 |
The total sustaining capital cost for the 2023 LOM Plan at CLG is estimated at $160.2 million. Sustaining capital costs are summarized in Table 7 below.
Sustaining capital costs include underground access development to the lower levels in the Central and North-West Zones, and development of the South-East zone including ventilation infrastructure, together with equipment replacements and miscellaneous infrastructure projects including upgrades to the underground dewatering system as the mine is further developed, and two additional tailings dam raises anticipated to be completed in 2025 and 2028.
Table 7: 2023 LOM Plan Sustaining Capital Costs Summary
Sustaining Capital Costs | LOM ($M) | |
Mine Development | $91.1 | |
Infrastructure and Equipment | $69.1 | |
Total Sustaining Capital Cost | $160.2 | |
The average 2023 LOM Plan site operating costs are estimated at $88.67 per tonne milled and are summarized in Table 8 below. Operating costs have been developed based on recent actual costs considering minor specific allowances for business improvement initiatives that are currently being implemented. Operating costs are based on long term assumptions, including a Mexican Peso exchange rate of MXN 20.00 per US$1.00.
Table 8: 2023 LOM Plan Unit Operating Costs Summary
Unit Operating Costs | LOM ($/t) | |
Mining | $44.14 | |
Processing | $26.64 | |
Mine General and Administrative | $17.90 | |
Total Operating Cost | $88.67 | |
All-in sustaining costs are defined in the Non-GAAP Financial Performance Measures section and summarized in Table 9 below.
Table 9: 2023 LOM Plan All-In Sustaining Costs(1)
Cash Costs and All-In Sustaining Costs | Units | LOM |
Cash Costs | $M | $983.8 |
Sustaining Capital | $M | $160.2 |
All-In Sustaining Costs | $M | $1,144.0 |
Payable Silver Ounces | Moz | 44.9 |
All-In Sustaining Costs before by-product credits | $/oz Ag payable | $25.45 |
By-Product Credits | $/oz Ag payable | ($18.84) |
By-product All-In Sustaining Costs | $/oz Ag payable | $6.61 |
Payable Silver Equivalent Ounces | Moz AgEq | 83.4 |
Co-product All-In Sustaining Costs | $/oz AgEq | $13.71 |
(1) | By-product AISC and Co-product AISC exclude the LGJV management fee and administrative costs of $1.09 / oz Ag payable and $0.59 / oz AgEq payable, respectively. Refer to Table 11 for AISC details. |
|
|
Opportunities - Growth, Margin Improvement and District-Scale Potential
The LGJV is analyzing multiple value enhancement projects beyond the 2023 LOM Plan and 2023 Mineral Reserve. Capital efficient modifications to the existing plant are being evaluated. The LGJV has completed preliminary metallurgical testwork on separation of a copper concentrate and increasing silver and gold recovery through leaching a pyrite concentrate. These processing concepts along with mill expansion projects will be analyzed over the coming year in conjunction with targeted increases to mineral reserves and further mine life extension initiatives, with the potential to increase throughput rates up to 4,000 tpd.
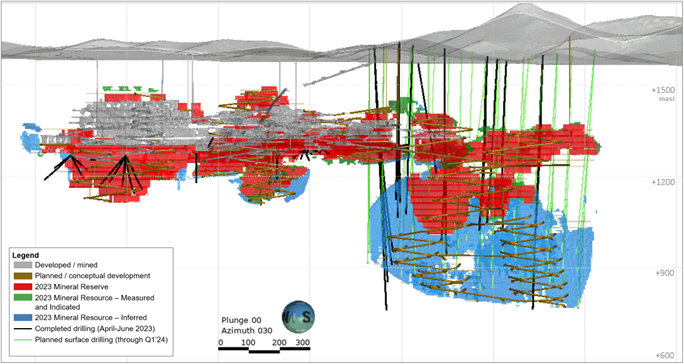
There are currently five surface drill rigs active on conversion drilling focused on the 2023 South-East Deeps inferred resource. The LGJV is using 1,100 metre elevation level to define the boundary of the South-East Deeps zone. The target of this drilling is to complete infill of the higher-grade portions of this zone to 50m spacing for classification upgrade in a mid-2024 mineral resource and reserve update. As reported in the Company’s July 17, 2023 quarterly exploration update press release, drilling continues to intercept high grade mineralization in this zone. Since the March 2023 database cut-off used for the 2023 Updates, an additional 27,769 metres of drilling has been completed (to the end of August 2023) which will be used in the 2024 updates to mineral reserves and resources together with further definition drilling planned (32,000 to 35,000 metres) over the next six months, as shown in Figure 5 below.
Figure 5 – Long Section of the CLG Mine Showing Drilling since March 31, 2023 Database Cutoff (black) and the Planned South East Deeps Surface Drilling (green)
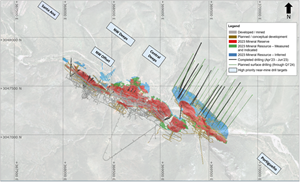
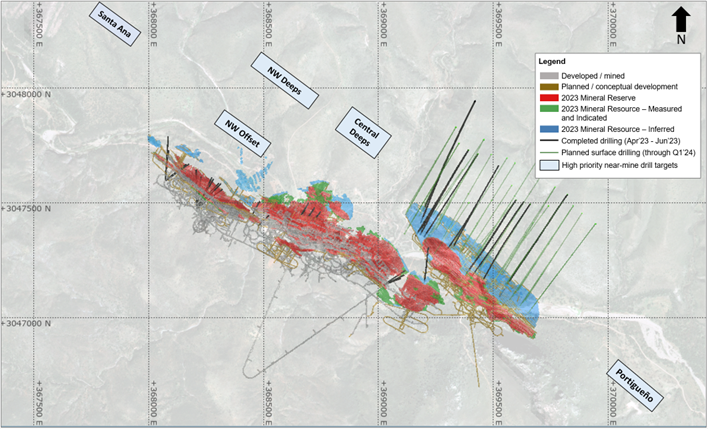
Near mine exploration is underway with testing of the Santa Ana zone approximately 1km north of the NW zone. There remain a number of prospective targets close to CLG shown in Figure 6 below that if successful could be accessed from the existing underground infrastructure. The LGJV intends to test these targets during late 2023 and 2024.
Figure 6 – Plan View of Near Mine Exploration Targets to be Tested During Q4 2023 and 2024
District exploration continues to be focused on foundational data acquisition, primarily mapping, rock chip sampling, drone air photos, and a magneto-telluric geophysical survey. The geology team has been expanded to accelerate detailed mapping of the district. A seventh drill rig is being mobilized in September which will increase the number of drill rigs operating on district targets to two starting in Q4-2023 and ramping up further at the end of Q1-2024 after the current stage of definition drilling on the South-East Deeps zone is completed.
Esther Resource Unchanged since 2022
The Esther Resource was not updated during 2023 and remains the same as reported in 2022.
Updated Technical Reports
The Company expects to file an updated technical report summary (TRS) prepared in accordance with subpart 1300 of Regulation S-K (“S-K 1300”) in the United States on the EDGAR section of the Securities and Exchange Commission (“SEC”) website at www.sec.gov, and file an updated technical report prepared in accordance with National Instrument 43-101 - Standards of Disclosure for Mineral Projects (“NI 43-101”) in Canada under the Company’s profile on SEDAR+ at www.sedarplus.ca (collectively, the “2023 Technical Reports”), to support the disclosure regarding the 2023 Updates. The 2023 Technical Reports are expected to be filed within 45 days.
Webcast and Conference Call
Investors and analysts are invited to attend the webcast and conference call as follows:
Date: September 7, 2023
Time: 11:00 a.m. ET
Listen-Only Webcast: https://events.q4inc.com/attendee/533876347
Direct Event Registration Link (for Analysts only): https://conferencingportals.com/event/GLfrdqKt
Dial-In Number: 1 (888) 330-2398 or 1 (240) 789-2709; press # to access an operator
An archive of the webcast will be available on the Company’s website at: https://gatossilver.com within 24 hours.
About Gatos Silver
Gatos Silver is a silver dominant exploration, development and production company that discovered a new silver and zinc-rich mineral district in southern Chihuahua State, Mexico. As a 70% owner of the Los Gatos Joint Venture (“LGJV”), the Company is primarily focused on operating the Cerro Los Gatos mine and on growth and development of the Los Gatos district. The LGJV includes approximately 103,000 hectares of mineral rights, representing a highly prospective and under-explored district with numerous silver-zinc-lead epithermal mineralized zones identified as priority targets.
Qualified Person
Scientific and technical disclosure in this press release regarding the Cerro Los Gatos 2023 Mineral Resource was based upon information prepared by or under the supervision of Ronald Turner, MAusIMM(CP), an employee of Golder Associates S.A. Scientific and technical disclosure in this press release regarding the 2023 Mineral Reserve, the 2023 LOM Plan and other economic analyses that will also be set out in the 2023 Technical Reports was based upon information prepared by or under the supervision of Stephan Blaho, P.Eng. an employee of WSP Canada Inc. Scientific and technical disclosure in this press release regarding the metallurgical assumptions for the 2023 LOM Plan and other economic analyses that will also be set out in the 2023 Technical Reports was based upon information prepared by or under the supervision of Adam Johnston, FAusIMM(CP), Chief Metallurgist with Transmin Metallurgical Consultants (UK). Other scientific and technical disclosure in this press release was approved by Anthony (Tony) Scott, P.Geo., Senior Vice President of Corporate Development and Technical Services of Gatos Silver. Each of Ronald Turner, MAusIMM(CP), Stephan Blaho, P.Eng., Adam Johnston, FAusIMM(CP), and Tony Scott, P.Geo. is a “Qualified Person,” as defined in S-K 1300 and NI 43-101. Ronald Turner, MAusIMM(CP), Stephan Blaho, P.Eng. and Adam Johnston, FAusIMM(CP) are all independent of Gatos Silver and the LGJV. Each Qualified Person has verified the data disclosed herein in respect of the subject matter associated with the Qualified Person identified above, including sampling, analytical, and test data underlying the related information or opinions.
Non-GAAP Financial Measures
The Company uses certain measures that are not defined by GAAP to evaluate various aspects of our business. These non-GAAP financial measures are intended to provide additional information only and do not have any standardized meaning prescribed by GAAP and should not be considered in isolation or as a substitute for measures of performance prepared in accordance with GAAP. The measures are not necessarily indicative of operating profit or cash flow from operations as determined under GAAP.
Cash Costs and All-In Sustaining Costs
Cash costs and all-in sustaining costs (“AISC”) are non-GAAP measures. AISC was calculated based on guidance provided by the World Gold Council (“WGC”). WGC is not a regulatory industry organization and does not have the authority to develop accounting standards for disclosure requirements. Other mining companies may calculate AISC differently as a result of differences in underlying accounting principles and policies applied, as well as definitional differences of sustaining versus expansionary (i.e. non-sustaining) capital expenditures based upon each company’s internal policies. Current GAAP measures used in the mining industry, such as cost of sales, do not capture all of the expenditures incurred to discover, develop and sustain production. Therefore, we believe that cash costs and AISC are non-GAAP measures that provide additional information to management, investors and analysts that aid in the understanding of the economics of the Company’s operations and performance compared to other producers and provides investors visibility by better defining the total costs associated with production.
Cash costs include all direct and indirect operating cash costs related directly to the physical activities of producing metals, including mining, processing and other plant costs, treatment and refining costs, general and administrative costs, and royalties. AISC includes total production cash costs incurred at the LGJV’s mining operations plus sustaining capital expenditures. The Company believes this measure represents the total sustainable costs of producing silver from current operations and provides additional information of the LGJV’s operational performance and ability to generate cash flows. As the measure seeks to reflect the full cost of silver production from current operations, new project and expansionary capital at current operations are not included. Certain cash expenditures such as new project spending, tax payments, dividends, and financing costs are not included.
Free Cash Flow
Management uses free cash flow (“FCF”) as a non-GAAP measure to analyze cash flows generated from operations. As used herein, FCF is cash provided by operating activities less cash used in investing activities. The Company believes that this measure assists in evaluating the Company’s ability to generate cash flow after capital investments. The most directly comparable measure prepared in accordance with GAAP is cash provided by operating activities. The Company believes FCF is also useful as one of the bases for comparing the Company’s performance with its competitors. Although FCF and similar measures are frequently used as measures of cash flows generated from operations by other companies, the Company’s calculation of FCF is not necessarily comparable to such other similarly titled captions of other companies. The Company is unable to provide without unreasonable efforts a reconciliation of forward-looking free cash flow on a per-year basis to cash flow provided by operating activities due to the inherent difficulty in forecasting and quantifying certain amounts, some of which may be material, that are necessary for such reconciliation.
Table 10: Reconciliation of FCF to Cash Flow from Operating Activities (as defined under US GAAP)
Free Cash Flow | Units | 2023 LOM Plan | |
Cash Flow provided by Operating Activities | $M | $707.7 | |
Cash Flow used in Investing Activities | $M | ($160.2) | |
After-Tax Free Cash Flow | $M | $547.5 | |
Mining and Income Taxes | $M | $129.2 | |
Pre-Tax Free Cash Flow | $M | $676.7 | |
Reconciliation of GAAP to non-GAAP measures
Table 11 below presents a reconciliation between the most comparable GAAP measure of the LGJV’s expenses to the non-GAAP measures of (i) cash costs, (ii) cash costs, net of by-product credits, (iii) co-product AISC and (iv) by-product AISC for the Company’s operations. The Company is unable to provide without unreasonable efforts a reconciliation of forward-looking AISC and related measures on a per-year basis to cost of sales due to the inherent difficulty in forecasting and quantifying certain amounts, some of which may be material, that are necessary for such reconciliation.
Table 11: Reconciliation of Cash Costs and AISC to Cost of Sales (as defined under US GAAP)
Cash Costs and All-In Sustaining Costs | Units | 2023 LOM Plan | 2022 LOM Plan |
Mining Costs | $M | $356.7 | $230.7 |
Milling Costs | $M | $215.3 | $131.3 |
Transportation Costs | $M | $116.4 | $79.9 |
Cost of Sales | $M | $688.5 | $442.0 |
Royalties | $M | $3.9 | $3.7 |
General and Administrative | $M | $144.6 | $85.7 |
Expenses | $M | $837.0 | $531.4 |
Treatment and Refining Costs | $M | $146.9 | $115.1 |
Cash Costs | $M | $983.8 | $646.5 |
Sustaining Capital | $M | $160.2 | $67.6 |
Accretion Expense | $M | $0.0 | $7.2 |
All-in Sustaining Costs (AISC)(1)(2) | $M | $1,144.0 | $721.3 |
By-product Credits(3) | $M | $(846.9) | $(536.9) |
Payable Silver | Moz | 44.9 | 30.9 |
Cash Costs before By-product Credits | $/oz Ag payable | $21.89 | $20.96 |
AISC before By-product Credits | $/oz Ag payable | $25.45 | $23.38 |
By-product Credits(3) | $/oz Ag payable | $(18.84) | $(17.40) |
By-product Cash Cost | $/oz Ag payable | $3.05 | $3.55 |
By-product AISC(1) | $/oz Ag payable | $6.61 | $5.98 |
Payable Silver Equivalent(3)(4) | Moz | 83.4 | 55.3 |
Co-product Cash Cost | $/oz AgEq payable | $11.79 | $11.70 |
Co-product AISC(1) | $/oz AgEq payable | $13.71 | $13.05 |
(1) | Excludes LGJV management fee and administration costs of approximately $6 million per year, equivalent to $1.09 / oz Ag payable and $0.59 / oz AgEq payable, respectively in the 2023 LOM Plan and $0.89 / oz Ag payable and $0.50 AgEq payable, respectively in the 2022 LOM Plan. |
(2) | Excludes any exploration costs related to future resource expansion and conversion. |
(3) | Assumes prices of $22.00/oz silver, $1.20/lb zinc, and $0.90/lb lead, $1,700/oz gold and $3.50/lb copper. |
(4) | Payable silver equivalent ounces include copper aligned to current payable terms for copper in lead concentrate. |
|
|
Forward-Looking Statements
This press release contains statements that constitute “forward looking information” and “forward-looking statements” within the meaning of U.S. and Canadian securities laws. All statements other than statements of historical facts contained in this press release, including statements regarding mineral resource and reserve estimates, potential cash flow and cash distributions to LGJV partners, life of mine, NPV, all-in sustaining costs, operating costs, economic analysis, CLG’s annual production, cash flow forecasts, projected capital and operating costs, future mill throughput rates, timing of updated 2023 Technical Reports, viability of potential modifications and projects to improve efficiency, expected mining methods, timing of proposed drilling and potential results from exploration including possible increases to the LOM, are forward-looking statements. Forward-looking statements are based on management’s beliefs, assumptions, current expectations about future events and on information currently available to management including without limitation assumptions about commodity prices, mining methodologies, the accuracy of Mineral Reserve and Resource estimates, operating and capital costs, plant throughput and processing recoveries, operating conditions, and including other assumptions set out herein and to be set out in the 2023 Technical Reports. Such statements are subject to risks, uncertainties, and other factors that could cause actual results to differ materially from those expressed or implied in the forward-looking statements including without limitation, commodity prices, change in regulations, failure to retain or obtain permits and licenses, environmental risks, cost and timing of exploration, development and production, opposition to mining may arise, labour interruptions, other general risks associated with mining operations and such other risks and uncertainties described in our filings with the U.S. Securities and Exchange Commission and Canadian securities commissions. Further, although the Company has attempted to identify factors that could cause actual actions, events or results to differ materially from those described in forward-looking statements, there may be other factors that cause actions, events or results not to be as anticipated, estimated or intended. Gatos Silver expressly disclaims any obligation or undertaking to update the forward-looking statements contained in this press release to reflect any change in its expectations or any change in events, conditions, or circumstances on which such statements are based unless required to do so by applicable law. No assurance can be given that such future results will be achieved, and as such, readers should not place undue reliance on forward-looking statements. Forward-looking statements speak only as of the date of this press release.
Investors and Media Contact
André van Niekerk
Chief Financial Officer
investors@gatossilver.com
(604) 424 0984
Photos accompanying this announcement are available at
https://www.globenewswire.com/NewsRoom/AttachmentNg/98083b40-cf48-4a1c-9cf0-302f88473c56
https://www.globenewswire.com/NewsRoom/AttachmentNg/3d7a2036-1a22-4f7c-bd6e-e03bd1f730f7
https://www.globenewswire.com/NewsRoom/AttachmentNg/fa11d924-bd5c-4ca9-8d08-c920478c61c3
https://www.globenewswire.com/NewsRoom/AttachmentNg/2b8bbf2d-e438-43df-b29d-929b92fd0f66
https://www.globenewswire.com/NewsRoom/AttachmentNg/15138844-a3d0-4b71-9d3d-a9add2bf1138
https://www.globenewswire.com/NewsRoom/AttachmentNg/958540a9-2466-4e23-92c3-b4bb89622c28

