GBP/USD Daily Forecast – Sterling Eases Back From Resistance
GBP/USD is Converging in Correlation with the Dollar
Last week’s recovery in GBP/USD was peculiar for two reasons. First, because Sterling has been notoriously weak for more than a month now. Second, because the pair managed to rally alongside the dollar.
Early this week the inverse correlation between GBP/USD and the dollar index (DXY) has started to converge a bit as the pair fell lower on Monday while the index rallied towards yearly highs.
While the currency pair still shows potential for further gains, where the dollar moves from here will be important for GBP/USD traders. If DXY ends up breaking above this years high to a fresh 27-month high, I think GBP/USD bulls will have a difficult time justifying their position. Granted, Sterling has shown some strength, but I think it makes more sense to play this strength in the cross rates considering the upward momentum in the greenback.
Having said that, GBP/USD is at a bit of an inflection point and the reaction from current levels might just set the near-term tone.
Technical Analysis
GBP/USD is seen testing a rising trendline on a 4-hour chart that originates from last week’s low. From what I’m looking at, the pair needs to get bid higher from here to maintain the recovery momentum.

There are a few levels to keep an eye on. If the pair fakes lower here, the 61.8% Fibonacci retracement of the leg higher from last weeks low comes in at 1.2075. That level should contain intraday moves lower and I see it as a last line in the sand for the pair.
Below that level, The next level of support comes in at 1.2047 as the level held the pair higher late last week. For the session ahead, I expect that this level is likely to hold buyers in the event the pair fails to hold the rising trendline.
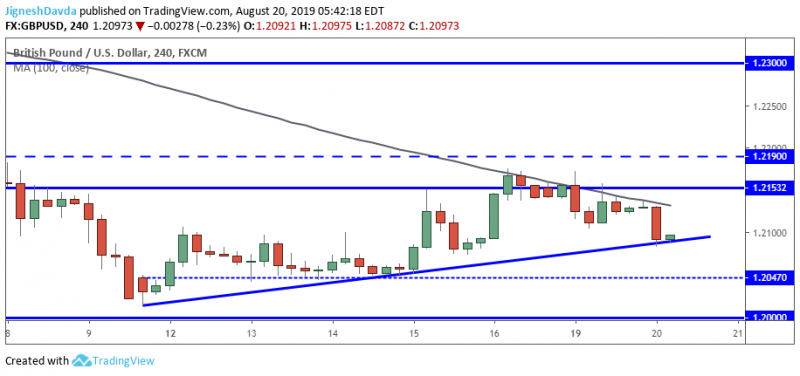
If buyers are able to keep the pair above the trendline, I see resistance for the session ahead at 1.2150. Slightly ahead of it, the 100- hour moving average may offer further resistance. As seen in the chart above, it has held several upside attempts since Friday.
Bottom line
GBP/USD is narrowing between a rising trendline and resistance from the 100-hour moving average. A break, in either direction, will clarify the near-term trend.
This article was originally posted on FX Empire
