Is Gen Digital Inc (GEN) a Potential Value Trap? A Comprehensive Analysis
Gen Digital Inc (NASDAQ:GEN) recently experienced a 6.44% gain, with an Earnings Per Share (EPS) of 2.12. However, the question arises: could this stock be a potential value trap? In this article, we'll delve into an in-depth valuation analysis of Gen Digital to provide you with comprehensive insights. Let's begin.
A Snapshot of Gen Digital Inc (NASDAQ:GEN)
Gen Digital is a cybersecurity pioneer offering security, identity protection, and privacy solutions to individual consumers. Its cyber safety offerings, including brands like Norton, Avast, and LifeLock, have solidified their positions as some of the most recognizable consumer-focused security and identity-protection products.
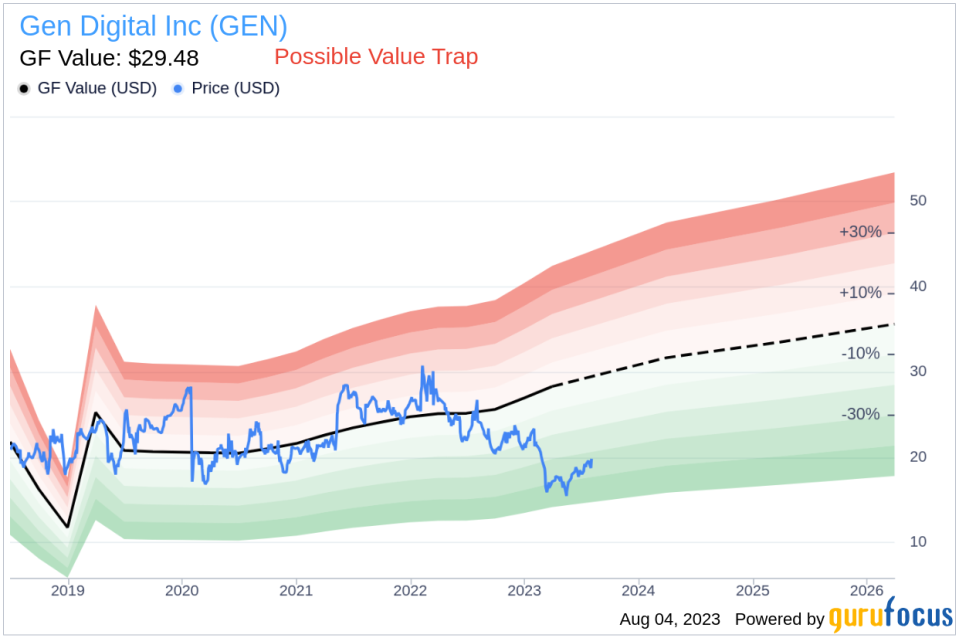
Currently, Gen Digital's stock price stands at $19.82 per share, with a market cap of $12.7 billion. This is contrasted with the GF Value, an estimation of fair value, which is $29.48. This discrepancy paves the way for a more profound exploration of the company's value, ingeniously integrating financial assessment with essential company details.
Understanding the GF Value of Gen Digital
The GF Value provides an estimate of a stock's intrinsic value, based on historical trading multiples, a GuruFocus adjustment factor, and future business performance estimates. In the case of Gen Digital (NASDAQ:GEN), the GF Value suggests that the stock may be a potential value trap, urging investors to think twice. This estimation is based on three key factors:
Historical multiples (PE Ratio, PS Ratio, PB Ratio, and Price-to-Free-Cash-Flow) that the stock has traded at.
GuruFocus adjustment factor based on the company's past returns and growth.
Future estimates of the business performance.
If the stock's share price is significantly above the GF Value Line, the stock may be overvalued and have poor future returns. Conversely, if the stock's share price is significantly below the GF Value Line, the stock may be undervalued and have high future returns.
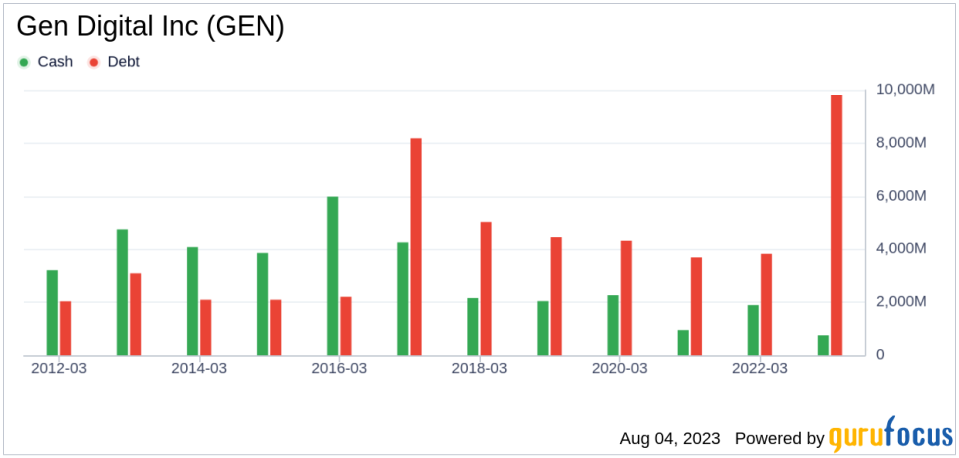
Financial Strength of Gen Digital
Investing in companies with low financial strength could result in permanent capital loss. Therefore, it's crucial to review a company's financial strength before deciding whether to buy shares. Gen Digital has a cash-to-debt ratio of 0.08, ranking worse than 93.81% of companies in the Software industry. Based on this, GuruFocus ranks Gen Digital's financial strength as 3 out of 10, suggesting a poor balance sheet.
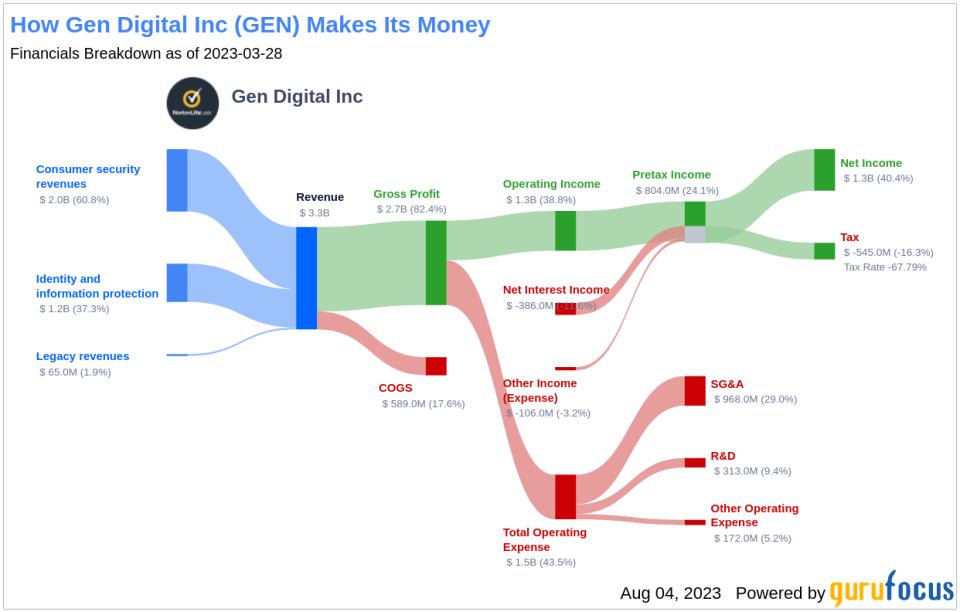
Profitability and Growth of Gen Digital
Investing in profitable companies, especially those demonstrating consistent profitability over the long term, poses less risk. Gen Digital has been profitable 9 over the past 10 years. Over the past twelve months, the company had a revenue of $3.3 billion and Earnings Per Share (EPS) of $2.12. Its operating margin is 38.83%, ranking better than 97.61% of companies in the Software industry. Overall, GuruFocus ranks the profitability of Gen Digital at 7 out of 10, indicating fair profitability.
One of the most important factors in the valuation of a company is growth. Companies that grow faster create more value for shareholders, especially if that growth is profitable. The average annual revenue growth of Gen Digital is 11.4%, which ranks better than 58.32% of companies in the Software industry. However, the 3-year average EBITDA growth is 4.7%, ranking worse than 58.58% of companies in the Software industry.
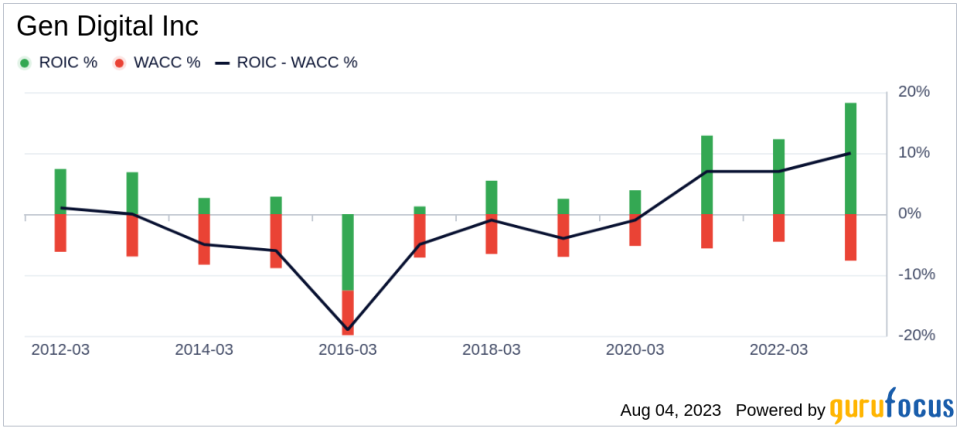
ROIC vs WACC
Comparing a company's return on invested capital (ROIC) to its weighted average cost of capital (WACC) can also evaluate its profitability. ROIC measures how well a company generates cash flow relative to the capital it has invested in its business. WACC is the rate that a company is expected to pay on average to all its security holders to finance its assets. If ROIC exceeds WACC, the company is likely creating value for its shareholders. During the past 12 months, Gen Digital's ROIC is 17.27 while its WACC came in at 7.58.
The Value Trap Indicators
The Beneish M-Score for Gen Digital stands at -1.52, surpassing the threshold of -1.78, hinting at the likelihood of earnings manipulation. Furthermore, the Altman Z-score for Gen Digital stands at 0.81, placing the company's financial health in the distress zone and signalling an increased bankruptcy risk. These indicators suggest that Gen Digital stock might be a value trap.
Conclusion
In conclusion, the stock of Gen Digital (NASDAQ:GEN) shows every sign of being a potential value trap. The company's financial condition is poor, and its profitability is fair. Its growth ranks worse than 58.58% of companies in the Software industry. To learn more about Gen Digital stock, you can check out its 30-Year Financials here.
To find out the high-quality companies that may deliver above-average returns, please check out GuruFocus High Quality Low Capex Screener.
This article first appeared on GuruFocus.
