General Mills (GIS) Q1 Earnings Beat Estimates, Sales Up Y/Y
General Mills, Inc. GIS posted first-quarter fiscal 2024 results, wherein the top line improved and the bottom line declined on a year-over-year basis. Both metrics came ahead of the Zacks Consensus Estimate.
Management remains focused on executing its Accelerate strategy. To this end, it has been committed to brand building and innovation, solidifying its capacities and reshaping its portfolio. GIS is on track with prioritizing core markets, global platforms and local brands, along with reshaping its portfolio via strategic acquisitions and divestitures.
Quarterly Highlights
General Mills posted adjusted earnings of $1.09 per share, which beat the Zacks Consensus Estimate of $1.08. However, the bottom line fell 1% year over year on a constant-currency (cc) basis. The decline can be mainly attributed to increased net interest expenses and a higher adjusted effective tax rate, somewhat negated by an increased adjusted operating profit and lower net shares outstanding.
GIS reported net sales of $4,904.7 million, which came above the Zacks Consensus Estimate of $4,865 million. The top line advanced 4% from the year-ago quarter’s figure. Organic net sales rose 4% due to the favorable organic net price realization and mix, partly countered by the reduced organic pound volume. The top line did not have any impact from net divestiture & acquisition activities or currency movements.
The adjusted gross margin expanded 50 basis points (bps) to 35.4% due to the positive net price realization and mix. This was somewhat offset by elevated input costs in the quarter. Our estimate for the adjusted gross margin was pegged at 35% for the reported quarter.
The cc adjusted operating profit increased by 2% year over year to $899 million as increased adjusted gross profit dollars were offset by higher adjusted SG&A expenses (which included a double-digit spike in media investments). The adjusted operating profit margin contracted by 40 bps to 18.3%.
General Mills, Inc. Price, Consensus and EPS Surprise
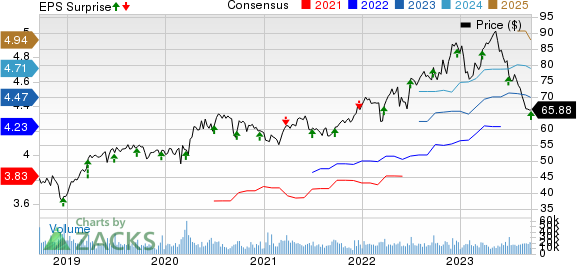
General Mills, Inc. price-consensus-eps-surprise-chart | General Mills, Inc. Quote
Segmental Performance
North America Retail: Revenues in the segment came in at $3,073 million, just managing to beat our estimate of 3,072.5 million. The metric increased by 3% year over year. The uptick can be attributed to the positive net price realization and mix, which more than offset the reduced pound volume, including a one-point adverse impact from divestitures. Organic net sales grew 4% year over year. The segment’s operating profit increased by 3% to $798 million.
International: Revenues in the segment came in at $715.8 million, up 10% year over year. The upside can be attributed to the favorable net price realization and mix and a one-point benefit from foreign currency exchange. This was partially offset by the reduced pound volume. Our estimate for the International segment’s revenues was pegged at $667.2 million for the quarter under review. Organic net sales grew 9% year over year, driven by double-digit growth in distributor markets in Europe & Australia. The segment’s operating profit surged 44% to $50 million.
Pet: Revenues came in at $580 million, which was flat year over year. Revenues were driven by positive net price realization and mix but hurt by the lower pound volume. Organic sales also remained flat. Segment net sales benefited from strong growth in dry pet food, which was offset by declines in pet treats. The segment’s operating profit came in at $111 million, down 10% on a year-over-year basis. Our estimate for the segment’s revenues was pegged at $610.3 million for the quarter.
North America Foodservice: Revenues came in at $536 million, up 8% year over year. Net sales were mainly backed by a four-point gain from the TNT Crust buyout. Organic sales rose 4%, including an adverse impact of six points from market index pricing on bakery flour. The segment’s operating profit grew 10% to $59 million, driven by favorable net price realization and mix. We had expected the segment to generate revenues of $553.7 million in the quarter.
Other Financial Aspects
General Mills ended the quarter with cash and cash equivalents of $490.9 million, long-term debt of $10,523.5 million and total shareholders’ equity of $10,262.4 million.
GIS generated $378.1 million in cash from operating activities in the first three months of fiscal 2024. Capital investments amounted to $142 million during the same period.
The company paid out dividends worth $348 million and bought roughly 6.4 million shares for $500 million in first-quarter fiscal 2024.
Other Developments
Constant currency sales from the joint ventures of Cereal Partners Worldwide increased by 8%. In Haagen-Dazs Japan, sales increased by 4% year over year at constant currency with the prior-year figure.
Fiscal 2024 Guidance
General Mills expects that the biggest factors impacting its performance in fiscal 2024 are likely to be consumers’ economic status, the moderating rate of cost inflation and the rising stability of supply-chain status.
For fiscal 2024, management expects input cost inflation of 5% of the total cost of goods sold, stemming from labor inflation. Labor inflation continues to impact the costs of sourcing, manufacturing and logistics. Management continues to expect Holistic Margin Management (HMM) cost savings of 4% of the cost of goods sold in fiscal 2024.
For fiscal 2024, organic net sales are anticipated to increase by 3-4%, driven by robust marketing, innovation and in-store support. Gains from net price realization through the company’s Strategic Revenue Management initiative are likely to aid.
The net impact of divestitures and foreign currency movements is likely to lower the full-year reported net sales growth by about half a percent.
The adjusted operating profit growth at cc is anticipated at 4-6%. Adjusted EPS growth at cc is also envisioned between 4% and 6%. Currency woes are likely to have a negligible impact on adjusted operating profit and adjusted EPS growth. The company expects a free cash flow conversion of at least 95% of adjusted after-tax earnings.
This Zacks Rank #4 (Sell) company’s shares have declined 19% in the past three months compared with the industry’s decline of 9.4%.
Solid Staple Stocks
Some better-ranked consumer staple stocks are Helen of Troy HELE, Flowers Foods FLO and Constellation Brands STZ, each carrying a Zacks Rank #2 (Buy). You can see the complete list of today’s Zacks #1 Rank (Strong Buy) stocks here.
Helen of Troy has a trailing four-quarter earnings surprise of 8.1%, on average. The Zacks Consensus Estimate for HELE’s current fiscal-year sales suggests a decline of around 10.1% from the year-ago reported figure.
Flowers Foods has a trailing four-quarter earnings surprise of 7.6%, on average. The Zacks Consensus Estimate for FLO’s current-year sales suggests growth of 6.7% from the year-ago reported number.
Constellation Brands has a trailing four-quarter earnings surprise of 4.4%, on average. The Zacks Consensus Estimate for STZ’s current fiscal-year sales suggests growth of around 6.8% from the year-ago reported figure.
Want the latest recommendations from Zacks Investment Research? Today, you can download 7 Best Stocks for the Next 30 Days. Click to get this free report
General Mills, Inc. (GIS) : Free Stock Analysis Report
Constellation Brands Inc (STZ) : Free Stock Analysis Report
Flowers Foods, Inc. (FLO) : Free Stock Analysis Report
Helen of Troy Limited (HELE) : Free Stock Analysis Report
