GF Score Analysis: A Deep Dive into Revvity Inc's Stock Performance
Revvity Inc. (NYSE:RVTY), a prominent player in the Medical Diagnostics & Research industry, is currently trading at $130.87 per share. With a market capitalization of $16.42 billion, the company's stock price has seen a gain of 3.27% today and a significant increase of 13.73% over the past four weeks. In this article, we will analyze Revvity Inc.'s GF Score and its implications on the company's future performance potential.
Understanding the GF Score
The GF Score is a stock performance ranking system developed by GuruFocus. It uses five aspects of valuation, which have been found to be closely correlated to the long-term performances of stocks. The GF Score ranges from 0 to 100, with 100 as the highest rank. Stocks with a higher GF Score generally generate higher returns than those with lower GF Scores. Therefore, when picking stocks, investors should invest in companies with high GF Scores.
Revvity Inc.'s GF Score Analysis
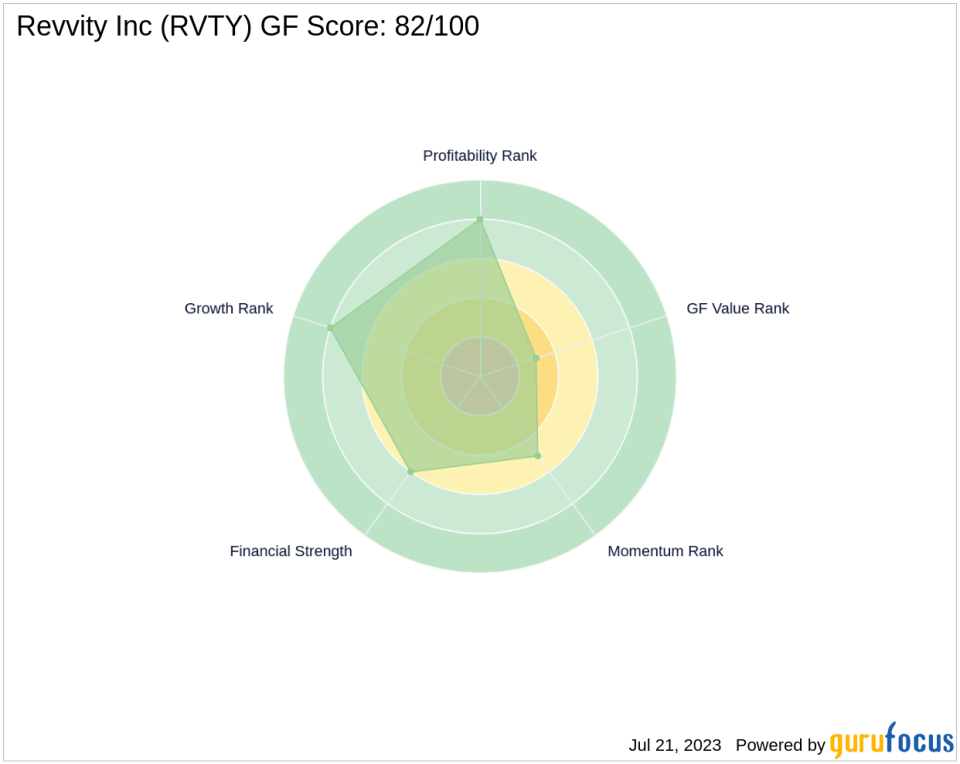
Revvity Inc.'s GF Score stands at 82 out of 100, indicating good outperformance potential. This score suggests that the company is likely to generate higher returns compared to other stocks with lower GF Scores. The GF Score takes into account five key aspects: Financial Strength, Profitability Rank, Growth Rank, GF Value Rank, and Momentum Rank.
Financial Strength Analysis
The Financial Strength Rank measures how strong a company's financial situation is. Revvity Inc.'s Financial Strength Rank is 6 out of 10, indicating a relatively strong financial position. The company's interest coverage is 5.84, and its debt to revenue ratio is 1.34. Its Altman Z score is 2.51, which is considered safe.
Profitability Rank Analysis
The Profitability Rank ranks how profitable a company is and how likely the company's business will stay that way. Revvity Inc.'s Profitability Rank is 8 out of 10, suggesting a high level of profitability. The company's Operating Margin is 17.11%, and its Piotroski F-Score is 5, indicating a healthy financial situation.
Growth Rank Analysis
The Growth Rank measures the growth of a company in terms of its revenue and profitability. Revvity Inc.'s Growth Rank is 8 out of 10, indicating a strong growth trajectory. The company's 5-year revenue growth rate is 5.90, and its 3-year revenue growth rate is 0.40. Its 5-year EBITDA growth rate is an impressive 26.70.
GF Value Rank Analysis
The GF Value Rank is determined by the price-to-GF-Value ratio, a proprietary metric calculated based on historical multiples along with an adjustment factor based on a company's past returns and growth and future estimates of the business' performance. Revvity Inc.'s GF Value Rank is 3 out of 10, suggesting that the stock is currently undervalued.
Momentum Rank Analysis
The Momentum Rank is determined using the standardized momentum ratio and other momentum indicators. Revvity Inc.'s Momentum Rank is 5 out of 10, indicating a moderate momentum in the company's stock price performance.
Competitive Analysis
When compared to its main competitors in the Medical Diagnostics & Research industry, Revvity Inc. holds a competitive position. Waters Corp (NYSE:WAT) has a GF Score of 94, Quest Diagnostics Inc (NYSE:DGX) has a GF Score of 85, and Exact Sciences Corp (NASDAQ:EXAS) has a GF Score of 70. This suggests that Revvity Inc. has a good performance potential relative to its competitors.
In conclusion, Revvity Inc.'s high GF Score, strong financial strength, high profitability, and strong growth make it a promising investment. However, investors should also consider its GF Value Rank and Momentum Rank when making investment decisions.
This article first appeared on GuruFocus.
