GF Score Analysis: SBA Communications Corp (SBAC)
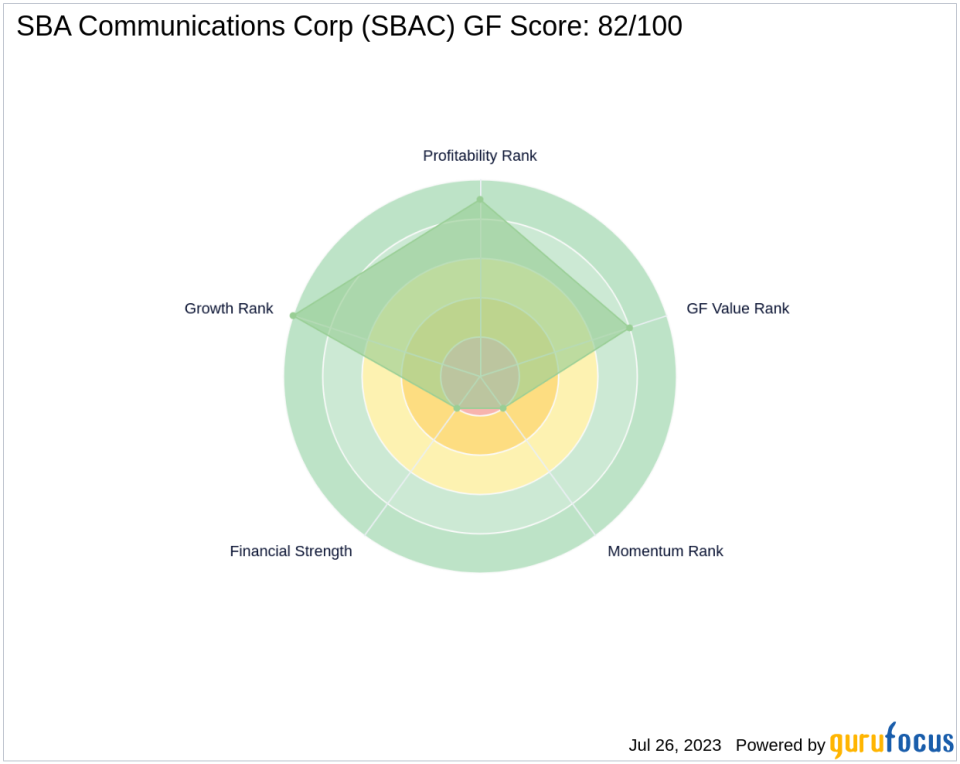
SBA Communications Corp (NASDAQ:SBAC) is a leading player in the REITs industry. As of July 26, 2023, the company's stock price stands at $227.9, with a market cap of $24.69 billion. The stock has seen a gain of 3.48% today and a 1.46% increase over the past four weeks. In this article, we will delve into the company's GF Score and its various components, providing a comprehensive analysis of its financial strength, profitability, growth, GF Value, and momentum ranks. The GF Score is a stock performance ranking system developed by GuruFocus, which ranges from 0 to 100, with 100 as the highest rank. SBAC's GF Score is 82/100, indicating good outperformance potential.
Financial Strength Analysis
The Financial Strength Rank measures a company's financial situation based on its debt burden, debt to revenue ratio, and Altman Z-Score. SBAC's Financial Strength Rank is 2/10. The company's interest coverage is 2.42, indicating a relatively high debt burden. Its debt to revenue ratio is 5.62, suggesting a high level of debt compared to its revenue. Furthermore, its Altman Z score is 0.42, which is below the safe zone of 1.8, indicating potential financial distress.
Profitability Rank Analysis
The Profitability Rank assesses a company's profitability and its likelihood to remain profitable. SBAC's Profitability Rank is 9/10, indicating high profitability. The company's Operating Margin is 37.99%, and its Piotroski F-Score is 6, suggesting a healthy financial situation. The trend of the Operating Margin over the past five years is 5.20%, indicating consistent profitability. The company has been profitable for 7 out of the past 10 years.
Growth Rank Analysis
The Growth Rank measures a company's revenue and profitability growth. SBAC's Growth Rank is 10/10, indicating strong growth. The company's 5-year revenue growth rate is 10.30%, and its 3-year revenue growth rate is 11.10%. Its 5-year EBITDA growth rate is 9.40%, suggesting consistent growth in its business operations.
GF Value Rank Analysis
The GF Value Rank is determined by the price-to-GF-Value ratio, a proprietary metric calculated based on historical multiples and an adjustment factor based on a company's past returns and growth. SBAC's GF Value Rank is 8/10, indicating that the stock is reasonably valued.
Momentum Rank Analysis
The Momentum Rank is determined using the standardized momentum ratio and other momentum indicators. SBAC's Momentum Rank is 2/10, suggesting that the stock's price momentum is relatively weak.
Competitor Analysis
SBAC's main competitors in the REITs industry are Weyerhaeuser Co (NYSE:WY), Digital Realty Trust Inc (NYSE:DLR), and Iron Mountain Inc (NYSE:IRM). WY has a GF Score of 84, DLR has a GF Score of 79, and IRM has a GF Score of 75. Compared to its competitors, SBAC's GF Score of 82 indicates a competitive position in the industry.
Conclusion
In conclusion, SBAC's overall GF Score of 82/100 suggests good outperformance potential. Despite its low Financial Strength and Momentum Ranks, the company's high Profitability and Growth Ranks, along with a reasonable GF Value Rank, make it an attractive investment. However, potential investors should consider the company's high debt burden and potential financial distress. The future outlook of SBAC based on its GF Score and ranks is promising, but investors should always conduct thorough research and consider all factors before making investment decisions.
This article first appeared on GuruFocus.
