Is Globex Mining Enterprises Inc (TSE:GMX) Attractive At This PE Ratio?

I am writing today to help inform people who are new to the stock market and want to learn about the link between company’s fundamentals and stock market performance.
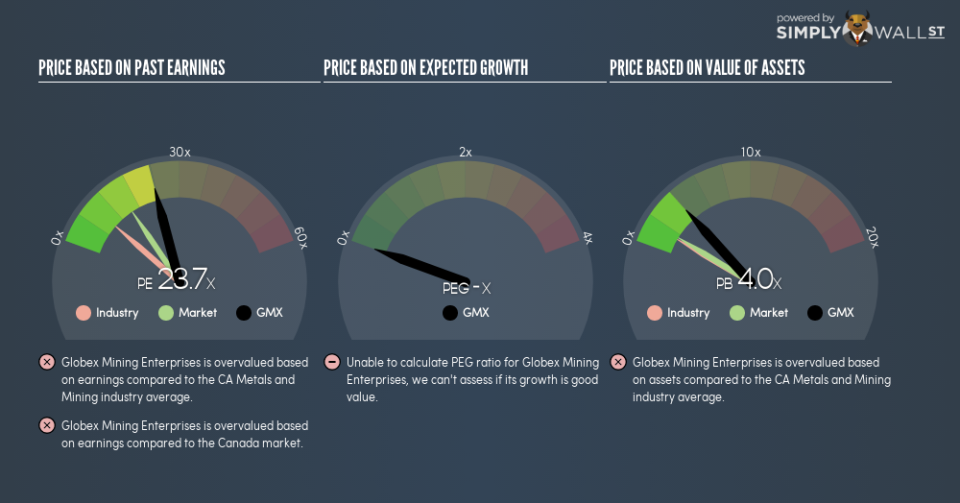
Globex Mining Enterprises Inc (TSE:GMX) trades with a trailing P/E of 23.7, which is higher than the industry average of 9.3. Although some investors may see this as unappealing, it is important to understand the assumptions behind the P/E ratio before making judgments. In this article, I will deconstruct the P/E ratio and highlight what you need to be careful of when using the P/E ratio.
See our latest analysis for Globex Mining Enterprises
Breaking down the Price-Earnings ratio
P/E is a popular ratio used for relative valuation. By comparing a stock’s price per share to its earnings per share, we are able to see how much investors are paying for each dollar of the company’s earnings.
P/E Calculation for GMX
Price-Earnings Ratio = Price per share ÷ Earnings per share
GMX Price-Earnings Ratio = CA$0.34 ÷ CA$0.0144 = 23.7x
The P/E ratio isn’t a metric you view in isolation and only becomes useful when you compare it against other similar companies. We preferably want to compare the stock’s P/E ratio to the average of companies that have similar features to GMX, such as capital structure and profitability. A quick method of creating a peer group is to use companies in the same industry, which is what I will do. GMX’s P/E of 23.7 is higher than its industry peers (9.3), which implies that each dollar of GMX’s earnings is being overvalued by investors. This multiple is a median of profitable companies of 25 Metals and Mining companies in CA including Winston Resources, Sulliden Mining Capital and European Electric Metals. You could think of it like this: the market is pricing GMX as if it is a stronger company than the average of its industry group.
A few caveats
Before you jump to conclusions it is important to realise that there are assumptions in this analysis. Firstly, that our peer group contains companies that are similar to GMX. If this isn’t the case, the difference in P/E could be due to other factors. Take, for example, the scenario where Globex Mining Enterprises Inc is growing profits more quickly than the average comparable company. In that case, the market may be correct to value it on a higher P/E ratio. Of course, it is possible that the stocks we are comparing with GMX are not fairly valued. Just because it is trading on a higher P/E ratio than its peers does not mean it must be overvalued. After all, the peer group could be undervalued.
What this means for you:
Since you may have already conducted your due diligence on GMX, the overvaluation of the stock may mean it is a good time to reduce your current holdings. But at the end of the day, keep in mind that relative valuation relies heavily on critical assumptions I’ve outlined above. Remember that basing your investment decision off one metric alone is certainly not sufficient. There are many things I have not taken into account in this article and the PE ratio is very one-dimensional. If you have not done so already, I highly recommend you to complete your research by taking a look at the following:
Financial Health: Are GMX’s operations financially sustainable? Balance sheets can be hard to analyze, which is why we’ve done it for you. Check out our financial health checks here.
Past Track Record: Has GMX been consistently performing well irrespective of the ups and downs in the market? Go into more detail in the past performance analysis and take a look at the free visual representations of GMX’s historicals for more clarity.
Other High-Performing Stocks: Are there other stocks that provide better prospects with proven track records? Explore our free list of these great stocks here.
To help readers see past the short term volatility of the financial market, we aim to bring you a long-term focused research analysis purely driven by fundamental data. Note that our analysis does not factor in the latest price-sensitive company announcements.
The author is an independent contributor and at the time of publication had no position in the stocks mentioned. For errors that warrant correction please contact the editor at editorial-team@simplywallst.com.
