GMS's Q1 Earnings Match, Net Sales Beat Estimates, Stock Down
GMS Inc. GMS reported mixed results for first-quarter fiscal 2024 (ended Jul 31, 2023), where earnings met the Zacks Consensus Estimate and revenues beat the same.
Net sales improved, but earnings declined on a year-over-year basis, driven by strong pricing in Wallboard, Ceilings and Complementary Products, as well as strength and stability in the end markets served.
Shares of the company fell 6.3% on Aug 31, post-earnings release. The downside in earnings might have hurt investors’ sentiments.
Although Steel Framing pricing and soft office demand remain headwinds, the company expects a sequential improvement in U.S. single-family permits and starts, along with solid multi-family activity and put-in-place construction spending growth in most commercial applications.
Quarter in Detail
GMS reported adjusted earnings of $2.40 per share, down 1.2% from the year-ago quarter’s $2.43.
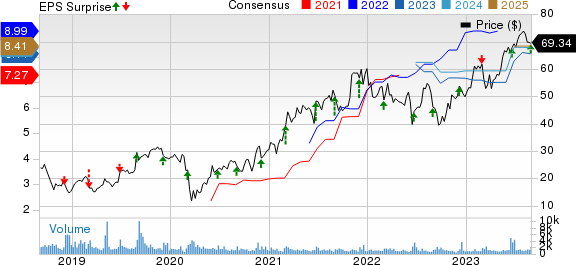
GMS Inc. Price, Consensus and EPS Surprise

GMS Inc. price-consensus-eps-surprise-chart | GMS Inc. Quote
Net sales of $1.41 billion topped the consensus mark of $1.37 million by 2.7% and increased 3.7% year over year. The upside was primarily driven by Wallboard volume growth of 22.1% for multi-family and 5.9% for commercial in the United States, partially offset by single-family volume declines of 12.5%. Organic net sales expanded by 1% from the prior-year quarter’s levels.
Segment Discussion
Wallboard sales increased 9.6% from a year ago to $571.4 million. Organically, sales were up 9.3% year over year.
Ceilings sales increased 4.7% year over year to $175.2 million for the quarter. Organically, this segment’s sales rose 2% from the year-ago quarter.
Steel Framing sales of $236.8 million fell 13.9% from the prior year. Organically, the segment’s sales declined 15% from the year-ago figure.
Complementary Product sales grew 7.7% from the prior-year period to $426.2 million. Organically, sales improved 0.7% from the year-ago period.
Operating Highlights
Gross margin remained flat at 32% year over year. Adjusted selling, general and administrative expenses — as a percentage of net sales — grew 60 basis points (bps) to 19.8% for the quarter.
Adjusted EBITDA of $173.3 million decreased 1% from a year ago. Adjusted EBITDA margin of 12.3% contracted 60 bps from a year ago.
Financials
As of Jul 31, 2023, the company had cash and cash equivalents of $81.4 million, up from $164.7 million at the fiscal 2023-end. Long-term debt (less current portion) amounted to $1.05 billion at July-end, up from $1.04 billion at fiscal 2023-end.
Cash provided by operating activities was $6.6 million in the first three months of fiscal 2024, versus $4.4 million in cash used in operating activities a year ago.
During the reported quarter, GMS repurchased 468,949 shares of common stock for $30.5 million. As of Jul 31, 2023, it had $69.6 million of share repurchase authorization remaining.
Zacks Rank & Recent Releases
GMS currently carries a Zacks Rank #2 (Buy). You can see the complete list of today’s Zacks #1 Rank (Strong Buy) stocks here.
Williams-Sonoma Inc. WSM reported mixed results in second-quarter fiscal 2023 (ended Jul 30, 2023). Earnings beat the Zacks Consensus Estimate, but revenues missed the same. The metrics declined year over year. The downside was primarily due to the increasing promotional environment and softening industry metrics.
WSM anticipates fiscal 2023 net revenues to decline between 5% and 10%. The company now expects its operating margin to be 15-16% versus earlier expectations of 14-15%.
Builders FirstSource BLDR reported second-quarter 2023 results wherein earnings and net sales surpassed the Zacks Consensus Estimate. The company has exceeded expectations, thanks to a more stable housing environment, a strong value-added product portfolio and the positive impact of operational initiatives implemented in recent years.
However, on a year-over-year basis, the results were hampered by declining single-family starts and commodity deflation.
Darden Restaurants, Inc. DRI reported fourth-quarter fiscal 2023 results, with earnings and revenues beating the Zacks Consensus Estimate. The metrics increased on a year-over-year basis.
For fiscal 2023, DRI expects sales to be approximately $11.5-$11.6 billion. Same-restaurant sales in fiscal 2024 are anticipated in the range of 2.5-3.5%. EPS from continuing operations is anticipated in the band of $8.55-$8.85. Its mid-point of $8.7 is lower than the Zacks Consensus Estimate of $8.73.
Want the latest recommendations from Zacks Investment Research? Today, you can download 7 Best Stocks for the Next 30 Days. Click to get this free report
Darden Restaurants, Inc. (DRI) : Free Stock Analysis Report
Builders FirstSource, Inc. (BLDR) : Free Stock Analysis Report
Williams-Sonoma, Inc. (WSM) : Free Stock Analysis Report
GMS Inc. (GMS) : Free Stock Analysis Report
