What Is Goldfield's (NYSEMKT:GV) P/E Ratio After Its Share Price Rocketed?

It's great to see Goldfield (NYSEMKT:GV) shareholders have their patience rewarded with a 32% share price pop in the last month. But shareholders may not all be feeling jubilant, since the share price is still down 16% in the last year.
All else being equal, a sharp share price increase should make a stock less attractive to potential investors. While the market sentiment towards a stock is very changeable, in the long run, the share price will tend to move in the same direction as earnings per share. So some would prefer to hold off buying when there is a lot of optimism towards a stock. Perhaps the simplest way to get a read on investors' expectations of a business is to look at its Price to Earnings Ratio (PE Ratio). A high P/E ratio means that investors have a high expectation about future growth, while a low P/E ratio means they have low expectations about future growth.
See our latest analysis for Goldfield
How Does Goldfield's P/E Ratio Compare To Its Peers?
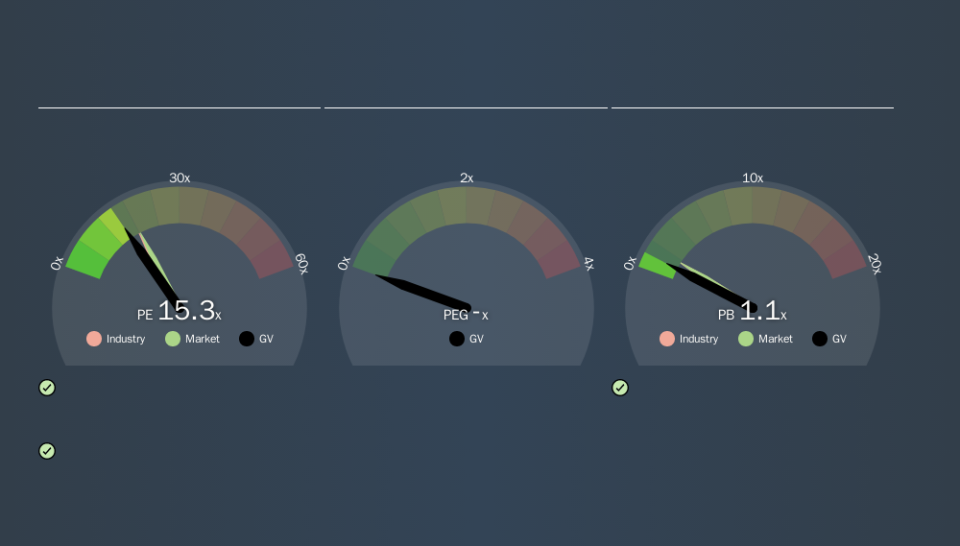
Goldfield's P/E of 15.25 indicates relatively low sentiment towards the stock. If you look at the image below, you can see Goldfield has a lower P/E than the average (17.9) in the construction industry classification.
This suggests that market participants think Goldfield will underperform other companies in its industry. Many investors like to buy stocks when the market is pessimistic about their prospects. It is arguably worth checking if insiders are buying shares, because that might imply they believe the stock is undervalued.
How Growth Rates Impact P/E Ratios
When earnings fall, the 'E' decreases, over time. That means unless the share price falls, the P/E will increase in a few years. A higher P/E should indicate the stock is expensive relative to others -- and that may encourage shareholders to sell.
Goldfield's earnings per share fell by 42% in the last twelve months. But it has grown its earnings per share by 6.4% per year over the last five years. And over the longer term (3 years) earnings per share have decreased 29% annually. This growth rate might warrant a low P/E ratio.
Don't Forget: The P/E Does Not Account For Debt or Bank Deposits
Don't forget that the P/E ratio considers market capitalization. Thus, the metric does not reflect cash or debt held by the company. In theory, a company can lower its future P/E ratio by using cash or debt to invest in growth.
Such expenditure might be good or bad, in the long term, but the point here is that the balance sheet is not reflected by this ratio.
So What Does Goldfield's Balance Sheet Tell Us?
Goldfield has net debt worth 20% of its market capitalization. That's enough debt to impact the P/E ratio a little; so keep it in mind if you're comparing it to companies without debt.
The Verdict On Goldfield's P/E Ratio
Goldfield's P/E is 15.3 which is below average (18.3) in the US market. With only modest debt, it's likely the lack of EPS growth at least partially explains the pessimism implied by the P/E ratio. What is very clear is that the market has become more optimistic about Goldfield over the last month, with the P/E ratio rising from 11.6 back then to 15.3 today. If you like to buy stocks that have recently impressed the market, then this one might be a candidate; but if you prefer to invest when there is 'blood in the streets', then you may feel the opportunity has passed.
Investors have an opportunity when market expectations about a stock are wrong. If the reality for a company is not as bad as the P/E ratio indicates, then the share price should increase as the market realizes this. Although we don't have analyst forecasts you might want to assess this data-rich visualization of earnings, revenue and cash flow.
Of course, you might find a fantastic investment by looking at a few good candidates. So take a peek at this free list of companies with modest (or no) debt, trading on a P/E below 20.
We aim to bring you long-term focused research analysis driven by fundamental data. Note that our analysis may not factor in the latest price-sensitive company announcements or qualitative material.
If you spot an error that warrants correction, please contact the editor at editorial-team@simplywallst.com. This article by Simply Wall St is general in nature. It does not constitute a recommendation to buy or sell any stock, and does not take account of your objectives, or your financial situation. Simply Wall St has no position in the stocks mentioned. Thank you for reading.
