GoldMining Announces Positive Preliminary Economic Assessment for the La Mina Project, Colombia, with Life of Mine Production of 1.74 Million Gold Equivalent Ounces
DESIGNATED NEWS RELEASE
VANCOUVER, BC, July 24, 2023 /PRNewswire/ - GoldMining Inc. (the "Company" or "GoldMining") (TSX: GOLD) (NYSE AMERICAN: GLDG) is pleased to announce the results of an updated preliminary economic assessment ("PEA") on the La Mina Project (the "Project") located in Antioquia, Colombia. The updated PEA incorporates the recently discovered La Garrucha Deposit into the mine plan, which was the subject of a maiden mineral resource estimate announced on January 23, 2023. Please refer to the Company's news release dated January 23, 2023 for further details.
All currency amounts herein are in US dollars unless otherwise indicated.
PEA Highlights
Total projected life of mine ("LOM") production of approximately 1.74 million gold equivalent ounces averaging 143,100 ounces over the estimated 12-year life.
Projected LOM production of 1.29 million ounces of gold, 203.9 million pounds of copper and 2.98 million ounces of silver at recoveries of 91%, 80% and 64%, respectively.
After-tax Net Present Value ("NPV (5%)") of approximately $274 million at base case commodity prices of $1,750 per ounce of gold, $21 per ounce of silver, and $3.50 per pound of copper; and approximately $434 million at spot commodity prices1.
Total cash cost of $786 per ounce of gold and All-In Sustaining Cost ("AISC") of $1,142 per ounce of gold (net of by-product credits).
Initial capital expenditures of approximately $425 million for a 15,000 tonne per day processing facility fed by a conventional truck and loader open pit mining operation with sustaining capital and mine closure expenditures of approximately $193 million.
Alastair Still, CEO of GoldMining commented, "We are pleased to update our PEA on La Mina, demonstrating the value we have created through the exploration discovery made at La Garrucha, such that the combined project represents a significant deposit of gold and copper with an attractive head grade above 1.0 g/t gold equivalent. Deposits of this scale with exploration upside and robust economics are becoming increasingly scarce, and La Mina exemplifies our efforts to advance our portfolio of projects in the Americas to unlock value for our shareholders. With current metal prices well above the $1,750 per ounce of gold and $3.50 per pound of copper used in the PEA, we believe the Project is well positioned for further enhanced economics and potential resource expansion."
Tim Smith, Vice President of Exploration for GoldMining commented, "La Mina comprises a classic porphyry cluster of multiple gold-copper deposits, with exploration potential for additional discoveries within the broader mineral system. Compared to many copper porphyry deposits globally, La Mina has a high ratio of gold to copper and as such the feed grade at La Mina of 1.01g/t gold equivalent is well above global averages for mineable porphyry systems. La Mina also has the added advantages of being located in moderate topography with existing road and power infrastructure, located just 40 km from the provincial capital city of Medellin, as compared to many porphyry copper deposits that are in remote locations and at extreme elevations. We look forward to evaluating further opportunities to expand the mineral resources at the existing deposits and to work towards additional discovery within the prospective regional land package."
1Recent commodity spot prices of $1,975/oz Au, $25/oz Ag, and $3.75/lb Cu. |
TABLE 1: PEA Summary of Key Metrics.
Parameter | Units | Base Case | Spot Price |
Metal Prices | |||
Gold | $oz | 1,750 | 1,975 |
Copper | $/lb | 3.50 | 3.75 |
Silver | $/oz | 21.00 | 25.00 |
Production Data | |||
Mine Life | years | 12.2 | |
Mined Mineralized Material | million tonnes | 61.3 | |
Process Plant Production Rate | tpd | 15,000 | |
Process Plant Feed Grade | Au g/t | 0.72 | |
Ag g/t | 2.36 | ||
Cu % | 0.19 | ||
AuEq g/t | 1.01 | ||
Strip Ratio | ratio | 5.81 | |
Average Annual Production | oz AuEq | 143,100 | |
Total LOM Payable Production | million oz AuEq | 1.69 | |
Operating Costs | |||
LOM Cash Unit Cost | $/t processed | 21.01 | |
LOM Total Cash Cost | $/oz | 786 | |
LOM All-In Sustaining Unit Cost | $/oz | 1,142 | |
Capital Costs | |||
Pre-production Capital | $ million | 424.8 | |
Sustaining Capital | $ million | 155.4 | |
Closure | $ million | 37.9 | |
Total Capital | $ million | 618.0 | |
Financial Analysis | |||
Pre-Tax NPV (5%) | $ million | 443.3 | 669.8 |
After-Tax NPV (5%) | $ million | 274.5 | 433.6 |
Pre-Tax IRR | % | 19.0 | 25.0 |
After-Tax IRR | % | 14.2 | 18.8 |
After-Tax Payback | years | 6.2 | 5.3 |
The PEA is preliminary in nature, and there is no certainty that the reported results will be realized. Mineral Resources used for the PEA include Inferred Mineral Resources which are considered too speculative geologically to have the economic considerations applied to them that would enable them to be categorized as Mineral Reserves, and there is no certainty that the projected economic performance will be realized. The purpose of the PEA is to demonstrate the economic viability of the La Mina Project, and the results are only intended as an initial, first-pass review of the Project economics based on preliminary information.
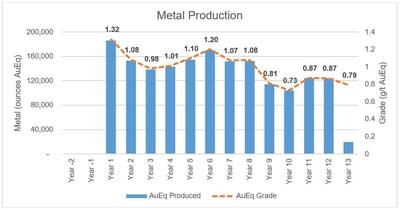
The PEA examined several mining scenarios with varying rates of production and cut-off grades and determined that a 12.2-year LOM and 61.3 million mineralized tonnes demonstrate robust financial returns using consensus metal prices. Refer to Figure 1 for the metal production profile.
Construction of the Project is expected to take approximately two years to complete and includes an assumed 15,000 tonne-per-day process plant. The operation is envisioned to produce both a copper concentrate with precious metal credits and doré. Capital and operating costs are estimated as of 2023 benchmarks and leverages on the Project's proximity to established infrastructure including roads, power and an available workforce.
To prepare the PEA, the Company engaged Resource Development Associates Inc. of Highlands Ranch, Colorado, which has been involved with the La Mina Project for the past 10 years and recently prepared the Mineral Resource Estimate for the La Garrucha Deposit.
The Company will continue to assess potential opportunities to further optimize the La Mina gold-copper porphyry open pit mine, with a view to advancing optimization work and additional studies in the coming years. A summary of potential future opportunities is presented in Table 2.
TABLE 2: Potential Future Opportunities
Opportunity | Potential Benefits |
Infill Drilling | Increase confidence in the geological models and controls on and
|
Exploration Drilling
Exploration drilling outside of the current resources
| Expansion opportunities at the existing deposits to delineate additional resources.
Porphyry cluster model predicts potential for new porphyry discoveries |
Metallurgical test work &
| Variability test work to optimize process flowsheet and improve gold, |
Geotechnical test work | Optimize pit wall slopes and potentially reduce strip ratio and to assess |
Infrastructure design &
| Optimize site layout, material handling and pit backfill to reduce LOM |
Environmental &
Metal Prices | Environmental baseline & heritage studies, and community stakeholder
Base case metal price assumptions in PEA are considerably below current spot prices for gold, copper and silver. |
The Project is well positioned to potentially further enhance economics by utilizing metals prices which are currently higher than the base case metal prices used in the PEA. Sensitivity to metal pricing is illustrated in Table 3.
TABLE 3: Economic Metrics Sensitivity Table.
Units | Gold Price (US$/oz) | |||||||
1,650 | 1,700 | 1,750 | 1,800 | 1,850 | 1,900 | 1,950 | ||
Pre-Tax NPV (5%) | $ million | 360.5 | 401.9 | 443.3 | 484.8 | 526.2 | 567.7 | 609.1 |
After-Tax NPV (5%) | $ million | 216.2 | 245.4 | 274.5 | 303.6 | 332.7 | 361.9 | 391.0 |
IRR (After-Tax) | % | 12.5 % | 13.4 % | 14.2 % | 15.1 % | 15.9 % | 16.8 % | 17.6 % |
Payback | years | 6.5 | 6.4 | 6.2 | 6.0 | 5.9 | 5.7 | 5.6 |
The mining plan utilized in the PEA uses conventional truck/loader open pit methods employing a fleet of trucks with haulage capacity of 139 tonnes and front-end loaders equipped with 19 cubic metre buckets. Three pit areas will be mined over a period of 12.2 production years. One pre-production year of stripping will be required followed by two years of stripping concurrent with production. Refer to Table 4 for the production and payable metal summary and to Figure 2 for the mined schedule. Mineralized material will be transported by haulage trucks to a nearby process plant and waste rock will either be stored as backfill or in proximity to the open pits. Mining will be conducted at an initial rate of 33 million total tonnes per annum (Mtpa) or 91 kilo tonnes per day (ktpd) to a peak rate of 52 Mtpa (142 ktpd) for total movement that will sustain the process plant.
The process plant feed is contained within an optimized subset of the Mineral Resource set out in the Pit Constrained Mineral Resource Estimate illustrated in Table 6. Collectively, the three pits contain 61.3 Mt of process plant feed (inclusive of mining dilution and loss factors) averaging 0.19% Cu, 0.72 g/t Au and 2.36 g/t Ag. Over LOM, 356 Mt of waste rock mined results in a waste to mineralized material strip ratio of 5.8:1.
Existing royalties have been included in the economic analysis and are comprised of a 2.0% net smelter return (NSR) royalty held by Gold Royalty Corp., and a gross revenue royalty of 4.0% on precious metals and 5.0% on base metals imposed by the Colombian National Mining Agency.
TABLE 4: Production and Payable Metal Summary
Copper | Gold | Silver | Gold Equivalent | |
Contained | 254.82 Mlbs | 1,420 koz | 4,660 koz | 1,986 koz |
Metallurgical Recovery | 80 % | 91 % | 64 % | |
Production | 203.86 Mlbs | 1,293 koz | 2,983 koz | 1,736 koz |
Payable | 195.71 Mlbs | 1 ,262 koz | 2,828 koz | 1,687 koz |

A recent metallurgical testing program was completed by ALS Global, based in Kamloops, British Columbia, Canada. The test work has identified an optimal process flowsheet including a typical copper concentrate and tailings leaching that achieves recoveries for gold and copper of 91% and 80%, respectively. Key components that describe the unit operating processes include the following:
Primary crushing and grinding in a SAG/ball mill circuit to a nominal 250-100 µm grind size;
Froth flotation to generate a copper rougher concentrate which is reground and subjected to two stages of cleaner flotation for copper grade improvement; copper concentrate is thickened, filtered and prepared for shipment to a smelter;
Cyanidation leach, carbon adsorption, carbon stripping and thermal regeneration, electrowinning and smelting to produce doré; and
Cyanide destruction of the final tailings.
Capital costs for the Project have been estimated by initial and sustaining capital categories. Mine closure has been accounted for and is expected to reclaim tailings and waste rock storage facilities (see Table 5).
TABLE 5: Capital Costs ($ Millions)
Initial | Sustaining | Total | |
Contractor Pre-Stripping | 10.0 | 32.5 | 42.5 |
Mining + Maintenance | -- | 97.7 | 97.7 |
Process Plant + Maintenance | 274.7 | 6.0 | 280.7 |
Tailings Management Facility | 6.0 | 5.6 | 11.6 |
Site Infrastructure | 65.0 | -- | 65.0 |
Owner's Cost + Contingency | 69.1 | 13.6 | 82.7 |
Sub-Total Capital | 424.8 | 155.4 | 580.1 |
Mine Closure | -- | 37.9 | 37.9 |
Total Capital | 424.8 | 193.3 | 618.0 |
TABLE 6: Pit Constrained Mineral Resource Estimate (Effective Date: December 20, 2022)
Grades | Contained Metal | ||||||||
Deposit | Tonnes | Au | Ag | Cu | AuEq | Au | Ag | Cu | AuEq |
(kt) | (g/t) | (g/t) | ( %) | (g/t) | (koz) | (koz) | (Mlbs) | (koz) | |
Indicated Mineral Resource | |||||||||
La Cantera | 17,614 | 0.86 | 2.03 | 0.31 | 1.32 | 487.0 | 1,149.6 | 120.5 | 749.2 |
La Garrucha | 7,358 | 0.65 | 3.14 | 0.11 | 0.84 | 153.8 | 742.8 | 17.8 | 199.5 |
Middle Zone | 8,800 | 0.54 | 1.28 | 0.11 | 0.71 | 152.8 | 362.1 | 21.2 | 200.9 |
Total Indicated | 33,772 | 0.73 | 2.08 | 0.21 | 1.06 | 793.6 | 2,254.5 | 159.4 | 1,149.6 |
Inferred Mineral Resource | |||||||||
La Cantera | 11,175 | 0.71 | 1.85 | 0.3 | 1.15 | 255.1 | 664.7 | 727.1 | 413.0 |
La Garrucha | 44,107 | 0.55 | 2.46 | 0.1 | 0.72 | 779.9 | 3,488.4 | 96.8 | 1,022.4 |
Middle Zone | 949 | 0.47 | 1.15 | 0.09 | 0.61 | 14.3 | 35.1 | 1.9 | 18.6 |
Total Inferred | 56,231 | 0.58 | 2.32 | 0.14 | 0.80 | 1,049.3 | 4,188.1 | 171.4 | 1,454.0 |
Notes: | |
1. | The qualified person for the above estimate is Scott Wilson, C.P.G, SME. |
2. | Mineral Resources are classified as Indicated Resources and Inferred Resources and are based on the 2014 CIM Definition Standards. The estimation of Indicated Mineral Resources involves greater uncertainty as to their existence and economic feasibility than the estimation of Mineral Reserves, and therefore investors are cautioned not to assume that all or any part of Indicated Mineral Resources will ever be converted into Mineral Reserves. The estimation of Inferred Mineral Resources involves greater uncertainty as to their existence and economic viability than the estimation of other categories of Mineral Resources. |
3. | Numbers may not add up due to rounding. |
4. | Cut-Off Grade: 0.30 g/t Au. |
5. | The Mineral Resource Estimate was based on US$ metal prices of $3.50/lb Cu, $1,700/oz Au and $21/oz Ag. |
6. | Gold-equivalent grades were calculated using the following formula: AuEq = Au (g/t) + [Cu(%) x {Cu Price/Au Price} x 22.0462 x 31.1035] + [Ag (g/t) x {Ag Price/Au Price}]. |
7. | The quantity and grade of reported Inferred Mineral Resources in this estimation are uncertain in nature and there has been insufficient exploration to define these Inferred Mineral Resources as Indicated or Measured Mineral Resources. |
8. | The author knows of no environmental, permitting, legal, title, taxation, socio-economic, marketing, political or other relevant factors that may materially affect the Mineral Resource Estimate. |
GoldMining will file an updated technical report for the La Mina PEA within 45 days of the date hereof.
Qualified Persons
Scott E. Wilson, CPG, SME-RM is with Resource Development Associates Inc. and is the independent consultant specializing in Mineral Reserve and Resource calculation reporting, mining project analysis and due diligence evaluations. Mr. Wilson is acting as the Qualified Person pursuant to Canadian Securities Administrator's National Instrument 43-101 – Standards of Disclosure for Mineral Projects ("NI 43-101"), for the PEA and is the primary author of the Technical Report for the Mineral Resource estimate and has reviewed and approved the Mineral Resource estimate and the PEA summarized in this news release. Mr. Wilson has over 31 years of experience in surface mining, resource estimation and strategic mine planning. Mr. Wilson is independent of the Company under NI 43-101. Mr. Wilson, a qualified person, has verified the data underlying the information disclosed herein, including sampling, analytical and test data underlying the information by reviewing the reports of methodologies, results and all procedures undertaken for quality assurance and quality control in a manner consistent with industry practice, and all matters were consistent and accurate according to his professional judgement. There were no limitations on the verification process.
Paulo Pereira, P. Geo., President of GoldMining Inc. and a Qualified Person as defined in NI 43-101, has supervised the preparation of this news release and has reviewed and approved the scientific and technical information contained herein.
About GoldMining Inc.
The Company is a public mineral exploration company focused on the acquisition and development of gold assets in the Americas. Through its disciplined acquisition strategy, the Company now controls a diversified portfolio of resource-stage gold and gold-copper projects in Canada, U.S.A., Brazil, Colombia and Peru. The Company also owns more than 21 million shares of Gold Royalty Corp (NYSE American: GROY), 9.8 million shares of U.S. GoldMining Inc. (Nasdaq: USGO), and 16.6 million shares of NevGold Corp. (TSXV: NAU).
Notice to Readers
Disclosure regarding the Project, including the PEA and Mineral Resource estimates included herein, has been prepared by the Company in accordance with NI 43-101. NI 43-101 is a rule developed by the Canadian Securities Administrators that establishes standards for public disclosure by issuer of scientific and technical information concerning mineral projects. NI 43-101 differs significantly from the disclosure requirements of the United States Securities and Exchange Commission ("SEC") generally applicable to U.S. companies subject to the SEC's disclosure requirements. For example, the terms "Indicated Mineral Resource" and "Inferred Mineral Resource" are defined in NI 43-101 by reference to the guidelines set out in the CIM Definition Standards on Mineral Resources and Mineral Reserves. Shareholders resident in the United States are cautioned that while terms are substantially similar to "indicated mineral resources" and "inferred mineral resources" as defined by the SEC, there are differences in the definitions and standards under applicable SEC Rules and NI 43-101. Accordingly, there is no assurance any mineral resources that the Company may report as "Indicated Mineral Resources" and "Inferred Mineral Resources" under NI 43-101 will be the same as the reserve or resource estimates prepared under rules applicable to United States domestic issuers. Investors are cautioned not to assume that any part or all of mineral resources will ever be converted into reserves. Pursuant to CIM Definition Standards, "Inferred mineral resources" are that part of a mineral resource for which quantity and grade or quality are estimated on the basis of limited geological evidence and sampling. Such geological evidence is sufficient to imply but not verify geological and grade or quality continuity. An inferred mineral resource has a lower level of confidence than that applying to an indicated mineral resource and must not be converted to a mineral reserve. However, it is reasonably expected that the majority of inferred mineral resources could be upgraded to indicated mineral resources with continued exploration. Under Canadian rules, estimates of inferred mineral resources may not form the basis of feasibility or pre-feasibility studies, except in rare cases. Investors are cautioned not to assume that all or any part of an inferred mineral resource is economically or legally mineable. Disclosure of "contained ounces" in a resource is permitted disclosure under Canadian regulations; however, the SEC normally only permits issuers to report mineralization that does not constitute "reserves" by SEC standards as in place tonnage and grade without reference to unit measures.
Forward-looking Statements
This news release contains certain forward-looking statements that reflect the current views and/or expectations of GoldMining with respect to its expectations and ongoing and proposed work at the La Mina Project, future exploration and work programs, the results of the PEA, including the production, operating and other cost estimates, metal price assumptions, cash flow projections, metal recoveries, mine life projections and production rates for the La Mina Project and the Company's expectations regarding potential opportunities to build upon the PEA. Forward-looking statements are based on the then-current expectations, beliefs, assumptions, estimates and forecasts about the business and the markets in which GoldMining operates. Investors are cautioned that all forward-looking statements involve risks and uncertainties, including: the inherent risks involved in the exploration and development of mineral properties, fluctuating metal prices, unanticipated costs and expenses, risks related to government and environmental regulation, social, permitting and licensing matters, and uncertainties relating to the availability and costs of financing needed in the future. These risks, as well as others, including those set forth in GoldMiningꞌs Annual Information Form for the year ended November 30, 2022, and other filings with Canadian securities regulators and the SEC, could cause actual results and events to vary significantly. Accordingly, readers should not place undue reliance on forward-looking statements and information. There can be no assurance that forward-looking information, or the material factors or assumptions used to develop such forward-looking information, will prove to be accurate. The Company does not undertake any obligations to release publicly any revisions for updating any voluntary forward-looking statements, except as required by applicable securities law.

View original content to download multimedia:https://www.prnewswire.com/news-releases/goldmining-announces-positive-preliminary-economic-assessment-for-the-la-mina-project-colombia-with-life-of-mine-production-of-1-74-million-gold-equivalent-ounces-301883680.html
SOURCE GoldMining Inc.
