Goodman Group's Dividend Analysis
Assessing the Upcoming Dividend and Financial Health of Goodman Group (GMGSF)
Goodman Group (GMGSF) recently announced a dividend of $0.15 per share, payable on 2024-02-23, with the ex-dividend date set for 2023-12-28. As investors look forward to this upcoming payment, the spotlight also shines on the company's dividend history, yield, and growth rates. Using the data from GuruFocus, let's look into Goodman Group's dividend performance and assess its sustainability.
What Does Goodman Group Do?
This Powerful Chart Made Peter Lynch 29% A Year For 13 Years
How to calculate the intrinsic value of a stock?
Goodman Group develops and manages industrial property investments worldwide. Rather than taking all risks on its own balance sheet, most Goodman developments are on behalf of end-user tenants, and funds management clients. A typical deal involves purchasing land for a tenant who wants to occupy the site, and/or an investor who will own the asset via a Goodman investment vehicle. Goodman charges leasing fees for locking in tenants, and fees for managing the development. Completed projects reside in Goodman investment vehicles, and Goodman charges asset and investment management fees to investors, in return for collecting rent and managing the site. Goodman retains a minority stake in many projects, generating rental income and aligning its interests with its funds management clients.

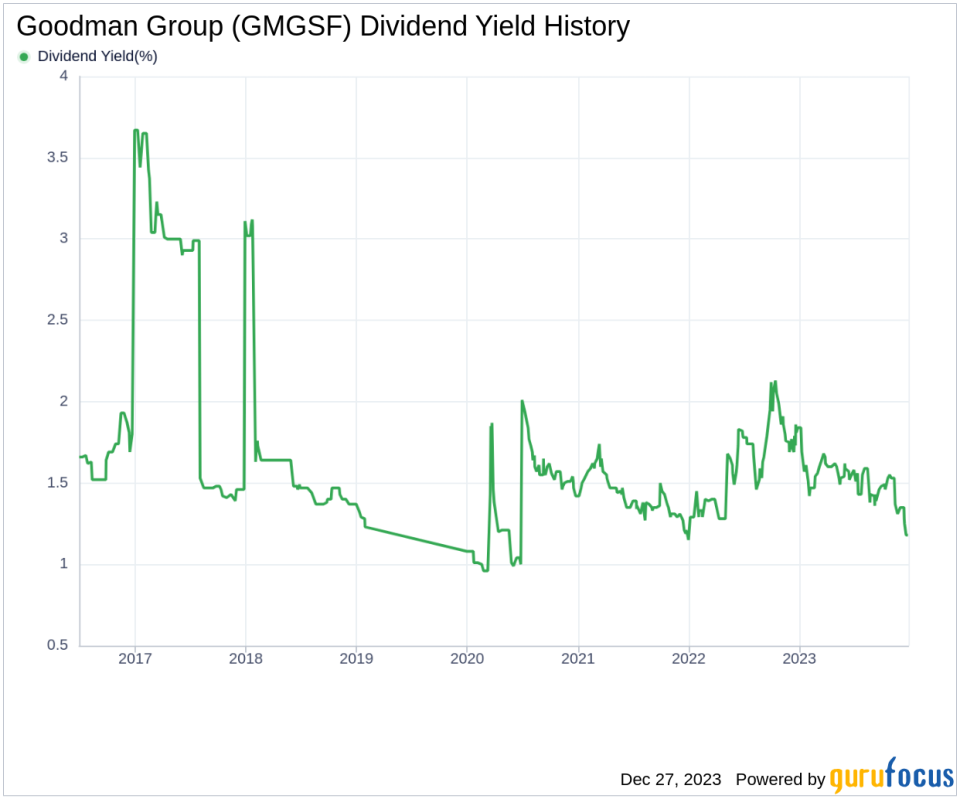
A Glimpse at Goodman Group's Dividend History
Goodman Group has maintained a consistent dividend payment record since 2019. Dividends are currently distributed on a bi-annually basis. Below is a chart showing annual Dividends Per Share for tracking historical trends.
Breaking Down Goodman Group's Dividend Yield and Growth
As of today, Goodman Group currently has a 12-month trailing dividend yield of 1.16% and a 12-month forward dividend yield of 1.16%. This suggests an expectation of the same dividend payments over the next 12 months.
Goodman Group's dividend yield of 1.16% is near a 10-year low and underperforms 84.43% of global competitors in the Real Estate industry, suggesting that the company's dividend yield may not be a compelling proposition for income investors. Extended to a five-year horizon, this rate increased to 1.00% per year. And over the past decade, Goodman Group's annual dividends per share growth rate stands at 4.80%.
Based on Goodman Group's dividend yield and five-year growth rate, the 5-year yield on cost of Goodman Group stock as of today is approximately 1.22%.
The Sustainability Question: Payout Ratio and Profitability
To assess the sustainability of the dividend, one needs to evaluate the company's payout ratio. The dividend payout ratio provides insights into the portion of earnings the company distributes as dividends. A lower ratio suggests that the company retains a significant part of its earnings, thereby ensuring the availability of funds for future growth and unexpected downturns. As of 2023-06-30, Goodman Group's dividend payout ratio is 0.37.
Goodman Group's profitability rank, offers an understanding of the company's earnings prowess relative to its peers. GuruFocus ranks Goodman Group's profitability 7 out of 10 as of 2023-06-30, suggesting good profitability prospects. The company has reported positive net income for each of year over the past decade, further solidifying its high profitability.
Growth Metrics: The Future Outlook
To ensure the sustainability of dividends, a company must have robust growth metrics. Goodman Group's growth rank of 7 out of 10 suggests that the company's growth trajectory is good relative to its competitors.
Revenue is the lifeblood of any company, and Goodman Group's revenue per share, combined with the 3-year revenue growth rate, indicates a strong revenue model. Goodman Group's revenue has increased by approximately 8.70% per year on average, which outperforms approximately 63.22% of global competitors.
The company's 3-year EPS growth rate showcases its capability to grow its earnings, a critical component for sustaining dividends in the long run. During the past three years, Goodman Group's earnings increased by approximately 0.50% per year on average, which outperforms approximately 47.03% of global competitors.
Lastly, the company's 5-year EBITDA growth rate of 5.20%, outperforms approximately 53.51% of global competitors.
Concluding Insights on Goodman Group's Dividend Profile
In conclusion, while Goodman Group's dividend yield is not the highest in the Real Estate industry, its consistent dividend payments and growth rate, combined with a reasonable payout ratio, indicate a sustainable dividend policy. The company's strong profitability and growth metrics further support the likelihood of ongoing dividend payments, making it an attractive option for value investors focused on steady income streams. With these factors in mind, investors should consider Goodman Group's overall financial health and growth prospects when evaluating its dividend attractiveness.
GuruFocus Premium users can screen for high-dividend yield stocks using the High Dividend Yield Screener.
This article, generated by GuruFocus, is designed to provide general insights and is not tailored financial advice. Our commentary is rooted in historical data and analyst projections, utilizing an impartial methodology, and is not intended to serve as specific investment guidance. It does not formulate a recommendation to purchase or divest any stock and does not consider individual investment objectives or financial circumstances. Our objective is to deliver long-term, fundamental data-driven analysis. Be aware that our analysis might not incorporate the most recent, price-sensitive company announcements or qualitative information. GuruFocus holds no position in the stocks mentioned herein.
This article first appeared on GuruFocus.
