Is Green Plains Inc’s (NASDAQ:GPRE) PE Ratio A Signal To Sell For Investors?

Green Plains Inc (NASDAQ:GPRE) is trading with a trailing P/E of 20.1x, which is higher than the industry average of 14.5x. Although some investors may jump to the conclusion that you should avoid the stock or sell if you own it, understanding the assumptions behind the P/E ratio might change your mind. Today, I will explain what the P/E ratio is as well as what you should look out for when using it. Check out our latest analysis for Green Plains
Breaking down the P/E ratio
The P/E ratio is one of many ratios used in relative valuation. It compares a stock’s price per share to the stock’s earnings per share. A more intuitive way of understanding the P/E ratio is to think of it as how much investors are paying for each dollar of the company’s earnings.
P/E Calculation for GPRE
Price-Earnings Ratio = Price per share ÷ Earnings per share
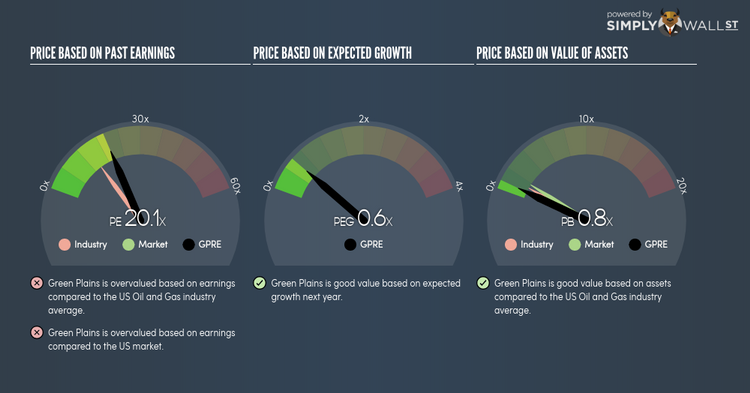
GPRE Price-Earnings Ratio = $16.8 ÷ $0.836 = 20.1x
The P/E ratio isn’t a metric you view in isolation and only becomes useful when you compare it against other similar companies. We preferably want to compare the stock’s P/E ratio to the average of companies that have similar features to GPRE, such as capital structure and profitability. One way of gathering a peer group is to use firms in the same industry, which is what I’ll do. At 20.1x, GPRE’s P/E is higher than its industry peers (14.5x). This implies that investors are overvaluing each dollar of GPRE’s earnings. As such, our analysis shows that GPRE represents an over-priced stock.
Assumptions to watch out for
However, before you rush out to sell your GPRE shares, it is important to note that this conclusion is based on two key assumptions. Firstly, our peer group contains companies that are similar to GPRE. If this isn’t the case, the difference in P/E could be due to other factors. For example, if you are comparing lower risk firms with GPRE, then its P/E would naturally be lower than its peers, as investors would value those with lower risk at a higher price. The second assumption that must hold true is that the stocks we are comparing GPRE to are fairly valued by the market. If this does not hold true, GPRE’s lower P/E ratio may be because firms in our peer group are overvalued by the market.
To help readers see pass the short term volatility of the financial market, we aim to bring you a long-term focused research analysis purely driven by fundamental data. Note that our analysis does not factor in the latest price sensitive company announcements.
The author is an independent contributor and at the time of publication had no position in the stocks mentioned.
