Group 1 Automotive, Inc.'s (NYSE:GPI) Intrinsic Value Is Potentially 22% Below Its Share Price
Key Insights
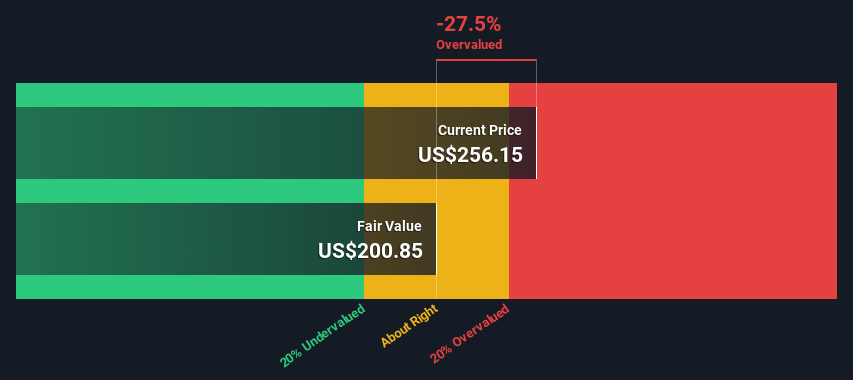
The projected fair value for Group 1 Automotive is US$201 based on 2 Stage Free Cash Flow to Equity
Group 1 Automotive's US$256 share price signals that it might be 28% overvalued
The US$283 analyst price target for GPI is 41% more than our estimate of fair value
In this article we are going to estimate the intrinsic value of Group 1 Automotive, Inc. (NYSE:GPI) by taking the expected future cash flows and discounting them to their present value. The Discounted Cash Flow (DCF) model is the tool we will apply to do this. There's really not all that much to it, even though it might appear quite complex.
Companies can be valued in a lot of ways, so we would point out that a DCF is not perfect for every situation. Anyone interested in learning a bit more about intrinsic value should have a read of the Simply Wall St analysis model.
Check out our latest analysis for Group 1 Automotive
Step By Step Through The Calculation
We use what is known as a 2-stage model, which simply means we have two different periods of growth rates for the company's cash flows. Generally the first stage is higher growth, and the second stage is a lower growth phase. To start off with, we need to estimate the next ten years of cash flows. Where possible we use analyst estimates, but when these aren't available we extrapolate the previous free cash flow (FCF) from the last estimate or reported value. We assume companies with shrinking free cash flow will slow their rate of shrinkage, and that companies with growing free cash flow will see their growth rate slow, over this period. We do this to reflect that growth tends to slow more in the early years than it does in later years.
A DCF is all about the idea that a dollar in the future is less valuable than a dollar today, so we need to discount the sum of these future cash flows to arrive at a present value estimate:
10-year free cash flow (FCF) estimate
2024 | 2025 | 2026 | 2027 | 2028 | 2029 | 2030 | 2031 | 2032 | 2033 | |
Levered FCF ($, Millions) | US$427.0m | US$342.2m | US$296.8m | US$271.1m | US$256.4m | US$248.3m | US$244.3m | US$243.2m | US$243.9m | US$246.0m |
Growth Rate Estimate Source | Analyst x1 | Est @ -19.86% | Est @ -13.27% | Est @ -8.66% | Est @ -5.43% | Est @ -3.17% | Est @ -1.58% | Est @ -0.47% | Est @ 0.30% | Est @ 0.84% |
Present Value ($, Millions) Discounted @ 11% | US$385 | US$278 | US$217 | US$179 | US$152 | US$133 | US$118 | US$106 | US$95.7 | US$87.0 |
("Est" = FCF growth rate estimated by Simply Wall St)
Present Value of 10-year Cash Flow (PVCF) = US$1.8b
The second stage is also known as Terminal Value, this is the business's cash flow after the first stage. The Gordon Growth formula is used to calculate Terminal Value at a future annual growth rate equal to the 5-year average of the 10-year government bond yield of 2.1%. We discount the terminal cash flows to today's value at a cost of equity of 11%.
Terminal Value (TV)= FCF2033 × (1 + g) ÷ (r – g) = US$246m× (1 + 2.1%) ÷ (11%– 2.1%) = US$2.8b
Present Value of Terminal Value (PVTV)= TV / (1 + r)10= US$2.8b÷ ( 1 + 11%)10= US$1.0b
The total value is the sum of cash flows for the next ten years plus the discounted terminal value, which results in the Total Equity Value, which in this case is US$2.8b. In the final step we divide the equity value by the number of shares outstanding. Compared to the current share price of US$256, the company appears slightly overvalued at the time of writing. Valuations are imprecise instruments though, rather like a telescope - move a few degrees and end up in a different galaxy. Do keep this in mind.
Important Assumptions
The calculation above is very dependent on two assumptions. The first is the discount rate and the other is the cash flows. Part of investing is coming up with your own evaluation of a company's future performance, so try the calculation yourself and check your own assumptions. The DCF also does not consider the possible cyclicality of an industry, or a company's future capital requirements, so it does not give a full picture of a company's potential performance. Given that we are looking at Group 1 Automotive as potential shareholders, the cost of equity is used as the discount rate, rather than the cost of capital (or weighted average cost of capital, WACC) which accounts for debt. In this calculation we've used 11%, which is based on a levered beta of 1.488. Beta is a measure of a stock's volatility, compared to the market as a whole. We get our beta from the industry average beta of globally comparable companies, with an imposed limit between 0.8 and 2.0, which is a reasonable range for a stable business.
SWOT Analysis for Group 1 Automotive
Strength
Debt is well covered by earnings.
Weakness
Earnings declined over the past year.
Dividend is low compared to the top 25% of dividend payers in the Specialty Retail market.
Opportunity
Good value based on P/E ratio compared to estimated Fair P/E ratio.
Threat
Debt is not well covered by operating cash flow.
Annual earnings are forecast to decline for the next 3 years.
Next Steps:
Valuation is only one side of the coin in terms of building your investment thesis, and it is only one of many factors that you need to assess for a company. DCF models are not the be-all and end-all of investment valuation. Preferably you'd apply different cases and assumptions and see how they would impact the company's valuation. If a company grows at a different rate, or if its cost of equity or risk free rate changes sharply, the output can look very different. Why is the intrinsic value lower than the current share price? For Group 1 Automotive, there are three important items you should look at:
Risks: You should be aware of the 3 warning signs for Group 1 Automotive (2 can't be ignored!) we've uncovered before considering an investment in the company.
Future Earnings: How does GPI's growth rate compare to its peers and the wider market? Dig deeper into the analyst consensus number for the upcoming years by interacting with our free analyst growth expectation chart.
Other High Quality Alternatives: Do you like a good all-rounder? Explore our interactive list of high quality stocks to get an idea of what else is out there you may be missing!
PS. The Simply Wall St app conducts a discounted cash flow valuation for every stock on the NYSE every day. If you want to find the calculation for other stocks just search here.
Have feedback on this article? Concerned about the content? Get in touch with us directly. Alternatively, email editorial-team (at) simplywallst.com.
This article by Simply Wall St is general in nature. We provide commentary based on historical data and analyst forecasts only using an unbiased methodology and our articles are not intended to be financial advice. It does not constitute a recommendation to buy or sell any stock, and does not take account of your objectives, or your financial situation. We aim to bring you long-term focused analysis driven by fundamental data. Note that our analysis may not factor in the latest price-sensitive company announcements or qualitative material. Simply Wall St has no position in any stocks mentioned.
Join A Paid User Research Session
You’ll receive a US$30 Amazon Gift card for 1 hour of your time while helping us build better investing tools for the individual investors like yourself. Sign up here
