Groupon, Inc.'s (NASDAQ:GRPN) Intrinsic Value Is Potentially 73% Above Its Share Price
Key Insights
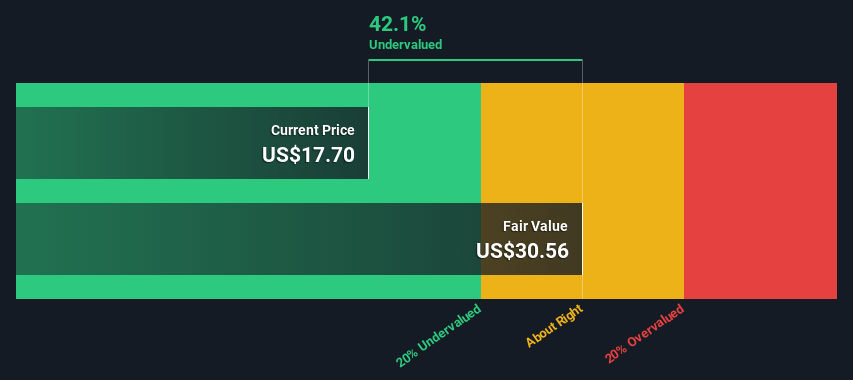
Groupon's estimated fair value is US$30.56 based on 2 Stage Free Cash Flow to Equity
Current share price of US$17.70 suggests Groupon is potentially 42% undervalued
Our fair value estimate is 81% higher than Groupon's analyst price target of US$16.88
Today we will run through one way of estimating the intrinsic value of Groupon, Inc. (NASDAQ:GRPN) by estimating the company's future cash flows and discounting them to their present value. We will take advantage of the Discounted Cash Flow (DCF) model for this purpose. Models like these may appear beyond the comprehension of a lay person, but they're fairly easy to follow.
We generally believe that a company's value is the present value of all of the cash it will generate in the future. However, a DCF is just one valuation metric among many, and it is not without flaws. For those who are keen learners of equity analysis, the Simply Wall St analysis model here may be something of interest to you.
See our latest analysis for Groupon
The Model
We use what is known as a 2-stage model, which simply means we have two different periods of growth rates for the company's cash flows. Generally the first stage is higher growth, and the second stage is a lower growth phase. To start off with, we need to estimate the next ten years of cash flows. Where possible we use analyst estimates, but when these aren't available we extrapolate the previous free cash flow (FCF) from the last estimate or reported value. We assume companies with shrinking free cash flow will slow their rate of shrinkage, and that companies with growing free cash flow will see their growth rate slow, over this period. We do this to reflect that growth tends to slow more in the early years than it does in later years.
A DCF is all about the idea that a dollar in the future is less valuable than a dollar today, so we need to discount the sum of these future cash flows to arrive at a present value estimate:
10-year free cash flow (FCF) estimate
2024 | 2025 | 2026 | 2027 | 2028 | 2029 | 2030 | 2031 | 2032 | 2033 | |
Levered FCF ($, Millions) | US$94.3m | US$111.9m | US$126.3m | US$98.7m | US$83.7m | US$75.4m | US$70.7m | US$68.1m | US$66.8m | US$66.4m |
Growth Rate Estimate Source | Analyst x2 | Analyst x2 | Analyst x2 | Analyst x1 | Est @ -15.16% | Est @ -9.93% | Est @ -6.26% | Est @ -3.70% | Est @ -1.90% | Est @ -0.64% |
Present Value ($, Millions) Discounted @ 7.8% | US$87.5 | US$96.3 | US$101 | US$73.1 | US$57.5 | US$48.1 | US$41.8 | US$37.3 | US$34.0 | US$31.3 |
("Est" = FCF growth rate estimated by Simply Wall St)
Present Value of 10-year Cash Flow (PVCF) = US$608m
We now need to calculate the Terminal Value, which accounts for all the future cash flows after this ten year period. The Gordon Growth formula is used to calculate Terminal Value at a future annual growth rate equal to the 5-year average of the 10-year government bond yield of 2.3%. We discount the terminal cash flows to today's value at a cost of equity of 7.8%.
Terminal Value (TV)= FCF2033 × (1 + g) ÷ (r – g) = US$66m× (1 + 2.3%) ÷ (7.8%– 2.3%) = US$1.2b
Present Value of Terminal Value (PVTV)= TV / (1 + r)10= US$1.2b÷ ( 1 + 7.8%)10= US$582m
The total value is the sum of cash flows for the next ten years plus the discounted terminal value, which results in the Total Equity Value, which in this case is US$1.2b. To get the intrinsic value per share, we divide this by the total number of shares outstanding. Relative to the current share price of US$17.7, the company appears quite undervalued at a 42% discount to where the stock price trades currently. The assumptions in any calculation have a big impact on the valuation, so it is better to view this as a rough estimate, not precise down to the last cent.
Important Assumptions
The calculation above is very dependent on two assumptions. The first is the discount rate and the other is the cash flows. If you don't agree with these result, have a go at the calculation yourself and play with the assumptions. The DCF also does not consider the possible cyclicality of an industry, or a company's future capital requirements, so it does not give a full picture of a company's potential performance. Given that we are looking at Groupon as potential shareholders, the cost of equity is used as the discount rate, rather than the cost of capital (or weighted average cost of capital, WACC) which accounts for debt. In this calculation we've used 7.8%, which is based on a levered beta of 1.197. Beta is a measure of a stock's volatility, compared to the market as a whole. We get our beta from the industry average beta of globally comparable companies, with an imposed limit between 0.8 and 2.0, which is a reasonable range for a stable business.
SWOT Analysis for Groupon
Strength
Debt is well covered by earnings.
Weakness
Shareholders have been diluted in the past year.
Opportunity
Forecast to reduce losses next year.
Trading below our estimate of fair value by more than 20%.
Threat
Debt is not well covered by operating cash flow.
Has less than 3 years of cash runway based on current free cash flow.
Total liabilities exceed total assets, which raises the risk of financial distress.
Revenue is forecast to decrease over the next 2 years.
Moving On:
Valuation is only one side of the coin in terms of building your investment thesis, and it is only one of many factors that you need to assess for a company. DCF models are not the be-all and end-all of investment valuation. Instead the best use for a DCF model is to test certain assumptions and theories to see if they would lead to the company being undervalued or overvalued. For instance, if the terminal value growth rate is adjusted slightly, it can dramatically alter the overall result. What is the reason for the share price sitting below the intrinsic value? For Groupon, there are three pertinent aspects you should explore:
Risks: Every company has them, and we've spotted 2 warning signs for Groupon you should know about.
Future Earnings: How does GRPN's growth rate compare to its peers and the wider market? Dig deeper into the analyst consensus number for the upcoming years by interacting with our free analyst growth expectation chart.
Other High Quality Alternatives: Do you like a good all-rounder? Explore our interactive list of high quality stocks to get an idea of what else is out there you may be missing!
PS. Simply Wall St updates its DCF calculation for every American stock every day, so if you want to find the intrinsic value of any other stock just search here.
Have feedback on this article? Concerned about the content? Get in touch with us directly. Alternatively, email editorial-team (at) simplywallst.com.
This article by Simply Wall St is general in nature. We provide commentary based on historical data and analyst forecasts only using an unbiased methodology and our articles are not intended to be financial advice. It does not constitute a recommendation to buy or sell any stock, and does not take account of your objectives, or your financial situation. We aim to bring you long-term focused analysis driven by fundamental data. Note that our analysis may not factor in the latest price-sensitive company announcements or qualitative material. Simply Wall St has no position in any stocks mentioned.
