Grupo Simec SAB de CV (SIM): A Comprehensive Analysis of Its Market Value
Grupo Simec SAB de CV (SIM) recently experienced a daily loss of -3.56% and a 3-month loss of -1.12%. Despite these losses, the company reported an Earnings Per Share (EPS) of 1.16. The question that arises is: is the stock fairly valued? This article aims to provide an in-depth analysis of the company's valuation, inviting readers to delve into the financial intricacies of Grupo Simec SAB de CV (SIM).
Company Introduction
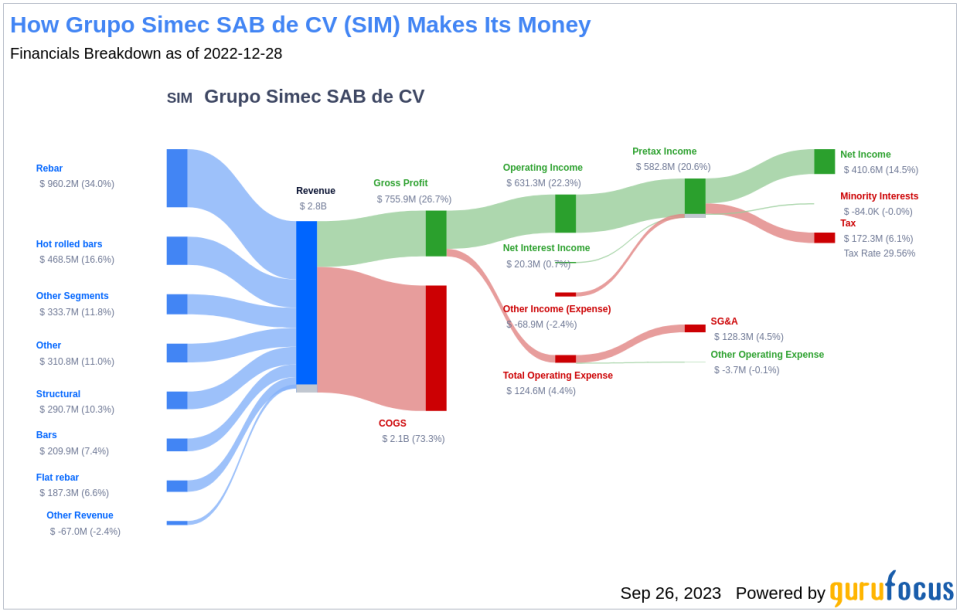
Grupo Simec SAB de CV is a diversified manufacturer, processor, and distributor of special bar quality (SBQ) steel, and structural steel products. With the United States, Brazil, and Mexico as its largest markets, the company's SBQ products find extensive use in engineered end-user applications. On the other hand, its structural steel products are primarily used in non-residential construction and other construction applications.
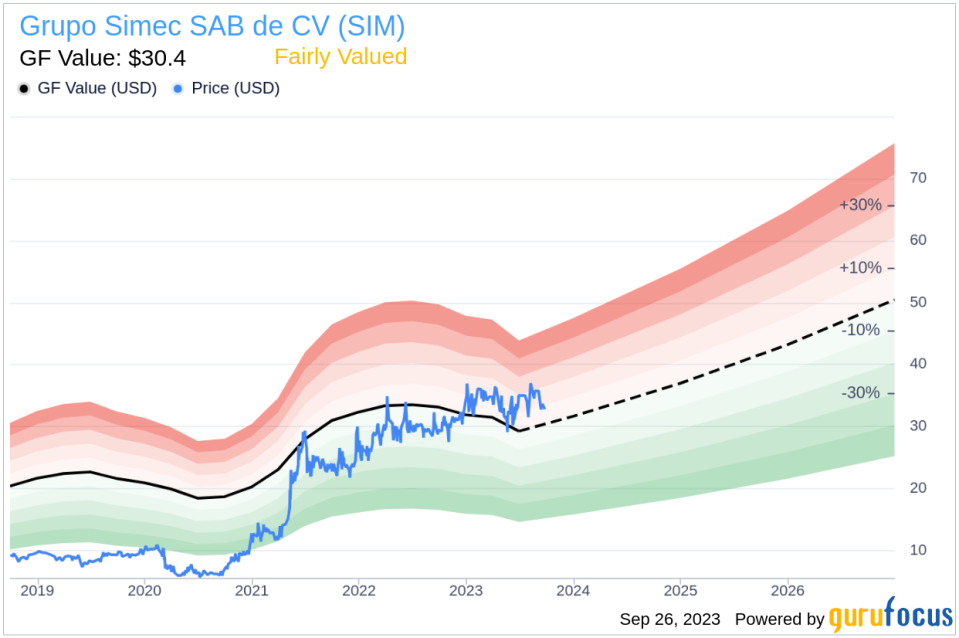
As of September 26, 2023, Grupo Simec SAB de CV (SIM) trades at $32.79 per share, with a market cap of $5.10 billion. The GF Value, an estimate of fair value, stands at $30.4, indicating that the stock might be fairly valued.
Understanding the GF Value
The GF Value is a proprietary measure that represents the current intrinsic value of a stock. It is derived from historical trading multiples, a GuruFocus adjustment factor based on past performance and growth, and future business performance estimates.
The GF Value Line, visible on our summary page, provides an overview of the fair value at which the stock should ideally be traded. If the stock price significantly deviates from the GF Value Line, it indicates that the stock is either overvalued or undervalued, with implications for its future return.
For Grupo Simec SAB de CV (SIM), the stock appears to be fairly valued. This implies that the long-term return of its stock is likely to be close to the rate of its business growth.
Link: These companies may deliver higher future returns at reduced risk.
Assessing Financial Strength
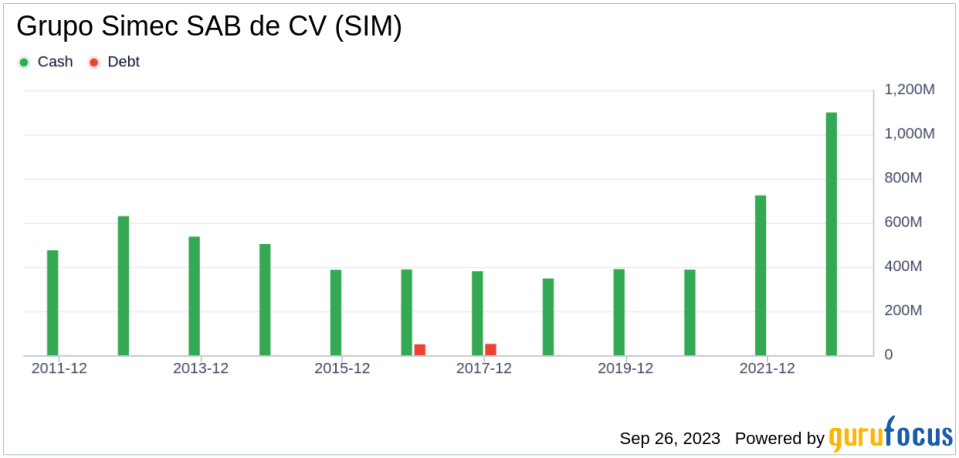
Investing in companies with low financial strength could result in permanent capital loss. Hence, reviewing a company's financial strength is crucial before deciding to buy shares. Key indicators like the cash-to-debt ratio and interest coverage offer a good initial perspective on the company's financial strength.
Grupo Simec SAB de CV boasts a cash-to-debt ratio of 4034.96, ranking better than 93.02% of 587 companies in the Steel industry. GuruFocus ranks Grupo Simec SAB de CV's financial strength as 10 out of 10, suggesting a strong balance sheet.
Profitability and Growth
Investing in profitable companies, especially those demonstrating consistent profitability over the long term, poses less risk. A company with high profit margins is typically a safer investment than one with low profit margins. Grupo Simec SAB de CV has been profitable 8 over the past 10 years. Over the past twelve months, the company reported a revenue of $2.50 billion and Earnings Per Share (EPS) of $1.16. Its operating margin is 20.36%, ranking better than 93.2% of 603 companies in the Steel industry. Overall, GuruFocus ranks the profitability of Grupo Simec SAB de CV at 8 out of 10, indicating strong profitability.
Growth is a crucial factor in the valuation of a company. GuruFocus research has found that growth is closely correlated with the long-term stock performance of a company. A faster-growing company creates more value for shareholders, especially if the growth is profitable. The 3-year average annual revenue growth of Grupo Simec SAB de CV is 16.8%, ranking better than 70.09% of 585 companies in the Steel industry. The 3-year average EBITDA growth rate is 64.2%, ranking better than 86.98% of 507 companies in the Steel industry.
ROIC vs WACC
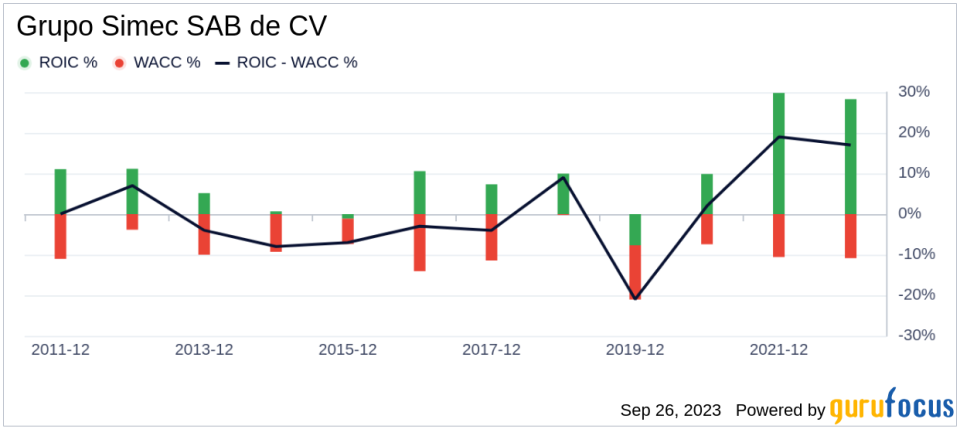
Another method of determining the profitability of a company is to compare its return on invested capital to the weighted average cost of capital. Return on invested capital (ROIC) measures how well a company generates cash flow relative to the capital it has invested in its business. The weighted average cost of capital (WACC) is the rate that a company is expected to pay on average to all its security holders to finance its assets. When the ROIC is higher than the WACC, it implies the company is creating value for shareholders. For the past 12 months, Grupo Simec SAB de CV's return on invested capital is 14.54, and its cost of capital is 10.52.
Conclusion
In conclusion, Grupo Simec SAB de CV (SIM) appears to be fairly valued. The company's financial condition is strong, and its profitability is robust. Its growth ranks better than 86.98% of 507 companies in the Steel industry. To learn more about Grupo Simec SAB de CV stock, you can check out its 30-Year Financials here.
To find out the high-quality companies that may deliver above-average returns, please check out GuruFocus High Quality Low Capex Screener.
This article first appeared on GuruFocus.
