Guardant Health (GH) Stock: A Hidden Value Trap? Unpacking the Risks and Rewards
Value-focused investors are always on the hunt for stocks that are priced below their intrinsic value. One such stock that merits attention is Guardant Health Inc (NASDAQ:GH). The stock, which is currently priced at 31.26, recorded a loss of 3.07% in a day and a 3-month decrease of 17.14%. The stock's fair valuation is $99.01, as indicated by its GF Value.
Understanding GF Value
The GF Value represents the current intrinsic value of a stock derived from our exclusive method. The GF Value Line on our summary page gives an overview of the fair value that the stock should be traded at. It is calculated based on three factors:
1. Historical multiples (PE Ratio, PS Ratio, PB Ratio and Price-to-Free-Cash-Flow) that the stock has traded at.
2. GuruFocus adjustment factor based on the company's past returns and growth.
3. Future estimates of the business performance.
We believe the GF Value Line is the fair value that the stock should be traded at. The stock price will most likely fluctuate around the GF Value Line. If the stock price is significantly above the GF Value Line, it is overvalued and its future return is likely to be poor. On the other hand, if it is significantly below the GF Value Line, its future return will likely be higher.
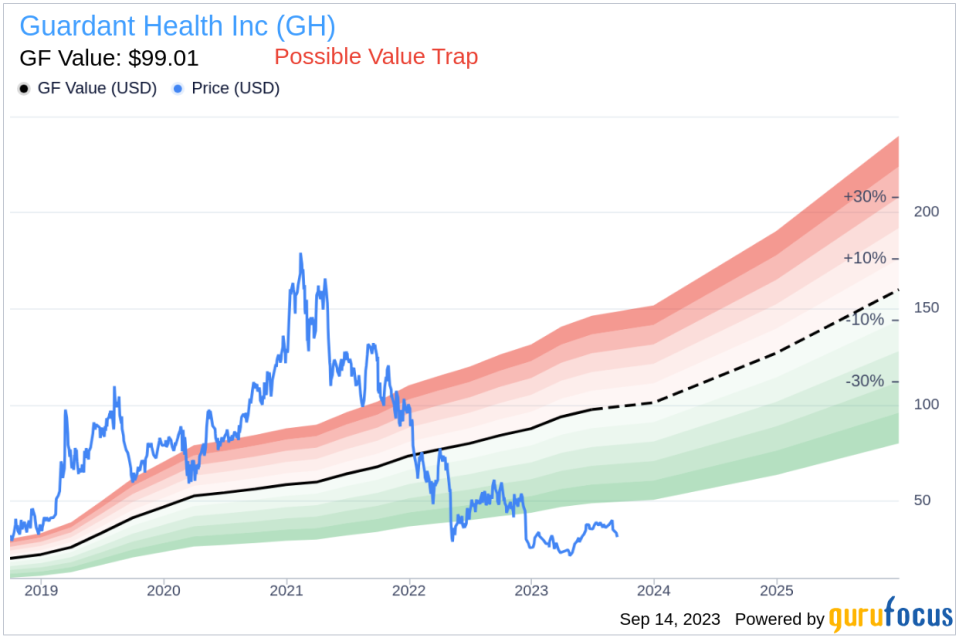
However, investors need to consider a more in-depth analysis before making an investment decision. Despite its seemingly attractive valuation, certain risk factors associated with Guardant Health should not be ignored. These risks are primarily reflected through its low Altman Z-score of 0.21. These indicators suggest that Guardant Health, despite its apparent undervaluation, might be a potential value trap. This complexity underlines the importance of thorough due diligence in investment decision-making.
Deciphering the Altman Z-Score
Before delving into the details, let's understand what the Altman Z-score entails. Invented by New York University Professor Edward I. Altman in 1968, the Z-Score is a financial model that predicts the probability of a company entering bankruptcy within a two-year time frame. The Altman Z-Score combines five different financial ratios, each weighted to create a final score. A score below 1.8 suggests a high likelihood of financial distress, while a score above 3 indicates a low risk.
Guardant Health: A Snapshot
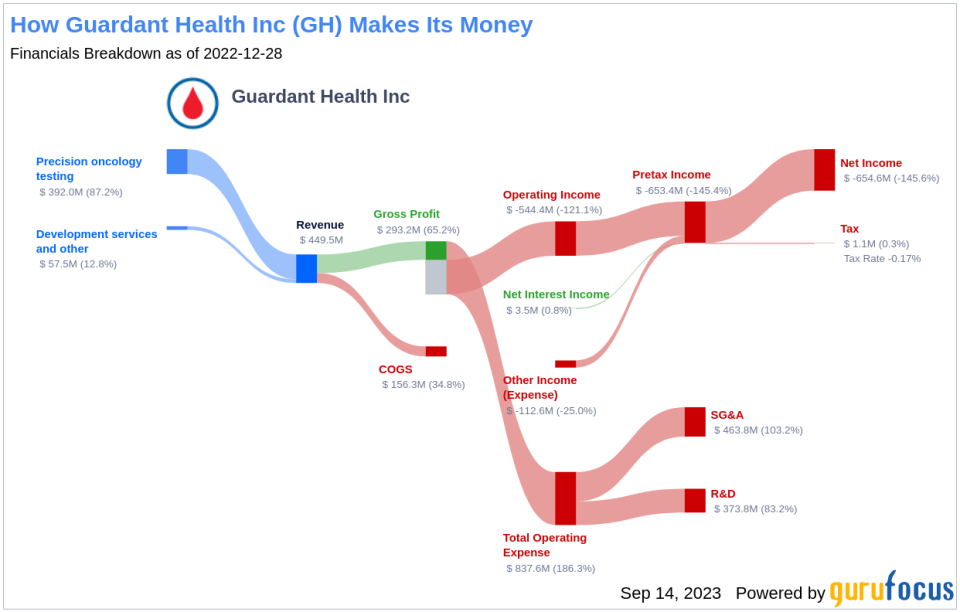
Guardant Health, based in Redwood City, California, provides cancer blood tests and analytics for clinical and research use, and the firm maintains research partnerships with large biopharmaceutical companies. The company offers Guardant 360, a blood-based (liquid biopsy) test for treatment selection in advanced stage cancer, and Guardant Omni, a broader gene panel for immuno-oncology research. The company's pipeline includes Guardant Reveal (formerly Lunar-1), for cancer recurrence detection in survivors, and Lunar-2, a liquid biopsy for early detection of cancer in higher-risk individuals, with an initial focus on colorectal cancer. Additionally, Guardant offers research development services. In 2022, the United States accounted for 94% of revenue, and other markets the remaining 6%.
This is the income breakdown of Guardant Health:
Guardant Health's Low Altman Z-Score: A Breakdown of Key Drivers
A dissection of Guardant Health's Altman Z-score reveals Guardant Health's financial health may be weak, suggesting possible financial distress:
The Retained Earnings to Total Assets ratio provides insights into a company's capability to reinvest its profits or manage debt. Evaluating Guardant Health's historical data, 2021: -0.35; 2022: -0.73; 2023: -1.02, we observe a declining trend in this ratio. This downward movement indicates Guardant Health's diminishing ability to reinvest in its business or effectively manage its debt. Consequently, it exerts a negative impact on its Z-Score.
The EBIT to Total Assets ratio serves as a crucial barometer of a company's operational effectiveness, correlating earnings before interest and taxes (EBIT) to total assets. An analysis of Guardant Health's EBIT to Total Assets ratio from historical data (2021: -0.16; 2022: -0.29; 2023: -0.27) indicates a descending trend. This reduction suggests that Guardant Health might not be utilizing its assets to their full potential to generate operational profits, which could be negatively affecting the company's overall Z-score.
Conclusion
Although Guardant Health's stock may appear undervalued at first glance, a closer look at its financial health suggests it might be a potential value trap. The company's declining Retained Earnings to Total Assets ratio and EBIT to Total Assets ratio, coupled with a low Altman Z-Score, indicate possible financial distress. Investors should therefore exercise caution and conduct thorough due diligence before making an investment decision.
GuruFocus Premium members can find stocks with high Altman Z-Score using the following Screener: Walter Schloss Screen .
This article first appeared on GuruFocus.
