How Has Guardian Capital Group Limited's (TSE:GCG.A) Performed Against The Industry?

Want to participate in a short research study? Help shape the future of investing tools and you could win a $250 gift card!
Understanding Guardian Capital Group Limited's (TSE:GCG.A) performance as a company requires examining more than earnings from one point in time. Today I will take you through a basic sense check to gain perspective on how Guardian Capital Group is doing by evaluating its latest earnings with its longer term trend as well as its industry peers' performance over the same period.
View our latest analysis for Guardian Capital Group
How Well Did GCG.A Perform?
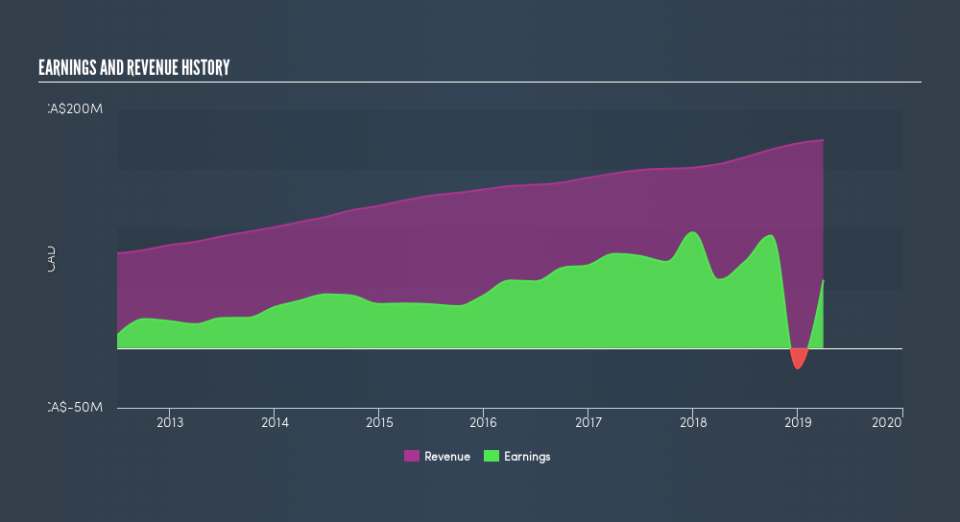
GCG.A's trailing twelve-month earnings (from 31 March 2019) of CA$56m has declined by -1.5% compared to the previous year.
Furthermore, this one-year growth rate has been lower than its average earnings growth rate over the past 5 years of 9.0%, indicating the rate at which GCG.A is growing has slowed down. What could be happening here? Let's examine what's transpiring with margins and whether the entire industry is facing the same headwind.
In terms of returns from investment, Guardian Capital Group has fallen short of achieving a 20% return on equity (ROE), recording 8.9% instead. Furthermore, its return on assets (ROA) of 5.9% is below the CA Capital Markets industry of 9.3%, indicating Guardian Capital Group's are utilized less efficiently. And finally, its return on capital (ROC), which also accounts for Guardian Capital Group’s debt level, has declined over the past 3 years from 8.2% to 6.9%. This correlates with an increase in debt holding, with debt-to-equity ratio rising from 15% to 21% over the past 5 years.
What does this mean?
While past data is useful, it doesn’t tell the whole story. Companies that are profitable, but have unpredictable earnings, can have many factors impacting its business. You should continue to research Guardian Capital Group to get a better picture of the stock by looking at:
Future Outlook: What are well-informed industry analysts predicting for GCG.A’s future growth? Take a look at our free research report of analyst consensus for GCG.A’s outlook.
Financial Health: Are GCG.A’s operations financially sustainable? Balance sheets can be hard to analyze, which is why we’ve done it for you. Check out our financial health checks here.
Other High-Performing Stocks: Are there other stocks that provide better prospects with proven track records? Explore our free list of these great stocks here.
NB: Figures in this article are calculated using data from the trailing twelve months from 31 March 2019. This may not be consistent with full year annual report figures.
We aim to bring you long-term focused research analysis driven by fundamental data. Note that our analysis may not factor in the latest price-sensitive company announcements or qualitative material.
If you spot an error that warrants correction, please contact the editor at editorial-team@simplywallst.com. This article by Simply Wall St is general in nature. It does not constitute a recommendation to buy or sell any stock, and does not take account of your objectives, or your financial situation. Simply Wall St has no position in the stocks mentioned. Thank you for reading.
