H.B. Fuller (FUL) Q2 Earnings & Sales Miss on Lower Volumes
H.B. Fuller Company FUL announced its second-quarter fiscal 2023 financial results. It reported adjusted earnings per share (EPS) of 93 cents. This figure fell short of the Zacks Consensus Estimate of $1.01, resulting in a negative earnings surprise of 7.92%. Adjusted EPS also declined from the prior-year quarter, primarily due to higher interest expense and unfavorable foreign currency impacts.
The company's net revenues for the quarter came in at $898.2 million, reflecting a 9.6% decline from the previous year's $993.3 million. This decrease in revenues was due to a 14.2% drop in volume, which was the result of customer destocking actions and slower industrial demand across all three global business units. The company also missed the Zacks Consensus Estimate for revenues of $964.2 million by 6.84%.
H. B. Fuller Company Price, Consensus and EPS Surprise
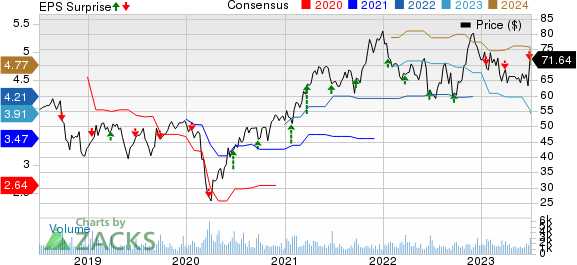
H. B. Fuller Company price-consensus-eps-surprise-chart | H. B. Fuller Company Quote
However, H.B. Fuller benefited from favorable pricing actions, which contributed 5.9 percentage points to organic growth, partially offsetting the volume decline. However, foreign currency translation had a negative impact of 3.4 percentage points on net revenue growth, while acquisitions contributed positively, increasing net revenue growth by 2.1 percentage points.
The company's gross profit for the quarter was $257 million, with an adjusted gross profit of $261 million. The adjusted gross profit margin experienced a year-on-year increase of 330 basis points to reach 29%. This improvement was primarily attributed to pricing and raw material cost actions, as well as operating efficiencies. These factors managed to offset the impact of lower volume on the gross margin.
Selling, general, and administrative (SG&A) expenses for the quarter were $167 million, and adjusted SG&A remained relatively flat year-on-year at $159 million. The company's good cost management, restructuring benefits and favorable foreign currency impacts helped counterbalance inflation in wages and services.
Adjusted EBITDA for the quarter amounted to $143 million, indicating a 3% increase from the same quarter in the previous year. The adjusted EBITDA margin experienced a year-on-year increase of 190 basis points, reaching 15.9%. This improvement was primarily driven by pricing and raw material cost actions, restructuring savings and other efficiencies. However, these gains were partially offset by the impacts of lower volume and inflation in wages and other costs.
Financials
H.B. Fuller's net debt at the end of the second quarter of fiscal 2023 was $1,779 million, showing a sequential increase of $31 million, primarily due to acquisitions. However, on a year-on-year basis, net debt decreased $89 million.
Cash flow from operations in the second quarter was $103 million, up $94 million from the year-ago quarter, driven by improved margins and reduced net working capital requirements.
Outlook
The company expressed confidence in its future performance. Despite a challenging volume environment and global industrial slowdown, underlying demand across the portfolio remains strong. The impact of customer destocking is tapering and year-over-year volume comparisons are expected to improve in the second half of the year. H.B. Fuller's diverse portfolio and innovation pipeline support ongoing product upgrades, driving profit growth. The company anticipates fading destocking activities, expanding EBITDA margins, improved demand in China, favorable foreign currency comparisons and continued benefits from restructuring. Overall, the company expects a stronger performance in the second half of the year.
The company sees adjusted EBITDA for fiscal 2023 in the band of $580-$610 million, representing growth of around 9-15% versus fiscal year 2022. Adjusted EPS is projected to be in the range of $3.80-$4.20, down 5% to up 5% year over year. Both net revenues and organic revenues for fiscal 2023 are now forecast to be down 3-5% year over year.
Price Performance
The company’s shares have risen 18.4% in the past year compared with the industry’s 15.2% increase.
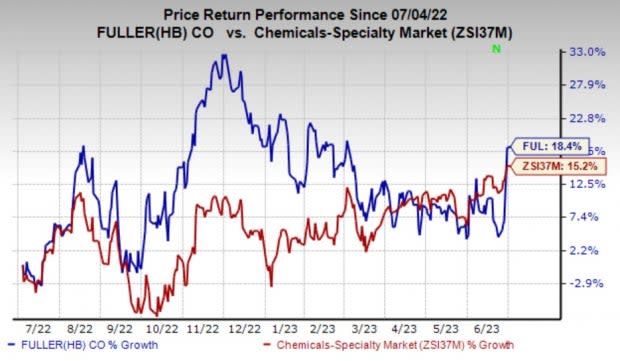
Image Source: Zacks Investment Research
Zacks Rank & Key Picks
H.B. Fullercurrently carries a Zacks Rank #4 (Sell).
Some better-ranked stocks in the basic materials space include L.B. Foster Company FSTR, sporting a Zacks Rank #1 (Strong Buy), and Koppers Holdings Inc. KOP and Linde Plc LIN, carrying a Zacks Rank #2 (Buy) each. You can see the complete list of today’s Zacks #1 Rank stocks here.
The Zacks Consensus Estimate for L.B. Foster’s current-year earnings is pegged at 53 cents per share, indicating year-over-year growth of 112.5%. The company’s shares have gained around 11.1% in the past year. FSTR beat the Zacks Consensus Estimate in all the last four quarters. It delivered a trailing four-quarter earnings surprise of 140.5%, on average.
Koppers currently carries a Zacks Rank #2. The consensus estimate for current-year earnings for KOP is currently pegged at $4.40, suggesting year-over-year growth of 6.3%. Koppers’shares have rallied roughly 51.1% in the past year.
The Zacks Consensus Estimate for Linde’s current-year earnings has been revised 4.4% upward in the past 60 days. LIN beat the Zacks Consensus Estimate in all the last four quarters, with the average earnings surprise being 6.9%. The company’s shares have gained 32.5% in the past year.
Want the latest recommendations from Zacks Investment Research? Today, you can download 7 Best Stocks for the Next 30 Days. Click to get this free report
L.B. Foster Company (FSTR) : Free Stock Analysis Report
Koppers Holdings Inc. (KOP) : Free Stock Analysis Report
H. B. Fuller Company (FUL) : Free Stock Analysis Report
Linde PLC (LIN) : Free Stock Analysis Report
