H&R REIT Reports Strong Fourth Quarter and Year-End 2023 Results
TORONTO, Feb. 13, 2024 /CNW/ - H&R Real Estate Investment Trust ("H&R" or "the REIT") (TSX: HR.UN) is pleased to announce its financial results for the three months and year ended December 31, 2023.
"We are pleased with our strong progress in executing our strategic plan over the last 30 months. Our team has been determined and resilient in the face of a challenging economic environment, and volatility in the capital and real estate markets. We are determined to surface significant unitholder value by transforming into a simplified growth-oriented company focused on residential and industrial properties" said Tom Hofstedter, Executive Chairman & Chief Executive Officer.
STRATEGIC REPOSITIONING HIGHLIGHTS DURING THE LAST 30 MONTHS:
Completed a spin off, on a tax-free basis, of 27 properties including all of the REIT's enclosed shopping centres to a new publicly-traded REIT, Primaris REIT, valued at approximately $2.4 billion;
45 investment properties totaling approximately $2.4 billion were sold including the Bow and 100 Wynford;
H&R to date has contracted to sell a further $293.2 million of properties in 2024;
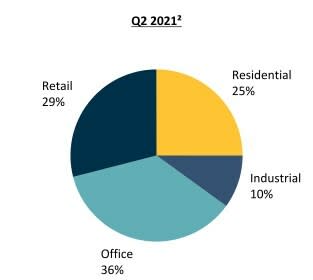
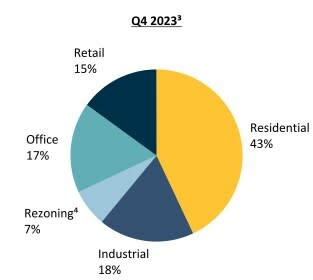
H&R's residential real estate assets at the REIT's proportionate share(1) increased from approximately $3.4 billion as at June 30, 2021 to approximately $4.4 billion as at December 31, 2023;
H&R's industrial real estate assets at the REIT's proportionate share(1) increased from approximately $1.3 billion as at June 30, 2021 to approximately $1.9 billion as at December 31, 2023;
H&R's office portfolio exposure at the REIT's proportionate share(1) was reduced from approximately $5.1 billion at June 30, 2021 to approximately $2.5 billion at December 31, 2023 ($703.5 million are properties advancing through the rezoning process);
H&R's retail portfolio at the REIT's proportionate share(1) decreased from approximately $4.0 billion as at June 30, 2021 to approximately $1.6 billion as at December 31, 2023;
H&R's portion of residential and industrial real estate assets at the REIT's proportionate share(1) increased from 35% as at June 30, 2021 to 61% as at December 31, 2023;
Debt per the REIT's Financial Statements was reduced from approximately $6.1 billion as at June 30, 2021 to approximately $3.7 billion as at December 31, 2023;
Debt to total assets at the REIT's proportionate share(2)(3) improved from 50.0% at June 30, 2021 to 44.0% as at December 31, 2023;
The unencumbered asset to unsecured debt coverage ratio improved from 1.65x as at June 30, 2021 to 2.16x as at December 31, 2023;
Debt to Adjusted EBITDA (based on trailing 12 months) at the REIT's proportionate share(2)(3)(5) improved from 10.4x at June 30, 2021 to 8.5x at December 31, 2023;
The REIT repurchased 27.0 million Units totalling $339.8 million between June 30, 2021 and December 31, 2023;
Operating results improved with a 14.9% increase in Same-Property net operating income (cash basis)(1) in 2022 and a further 10.3% in 2023;
Overall Occupancy grew from 93.7 % at June 30, 2021 to 96.5% at December 31, 2023;
H&R's exposure to Alberta real estate assets, at the REIT's proportionate share(1), was reduced from 16.9% at June 30, 2021 to only 4.5% at December 31, 2023.
HIGHLIGHTS FOR THE YEAR ENDED DECEMBER 31, 2023:
Net operating income increased by 2.2% compared to 2022. Property dispositions in the last 12 months totaled $432.9 million.
Same-Property net operating income (cash basis)(1) increased by 10.3% compared to 2022 driven by healthy gains across all our operating segments:
Residential 18.7 % Driven by strong rent growth and the strengthening of the U.S. dollar
Industrial 12.5 % Driven by strong rent growth and higher occupancy
Office 5.2 % Driven by higher lease termination fees, bad debt recoveries and the strengthening of the U.S. dollar
Retail 5.7 % Driven by increase in occupancy at River Landing Miami and the strengthening of the U.S. dollar
Funds From Operations ("FFO") per Unit(3) grew 13.0% to $1.33 per Unit compared to $1.17 per Unit in 2022. The REIT's payout ratio as a % of FFO was 52.8%(3) compared to 50.3%(3) in 2022 .
Cash distributions of $0.70 per Unit increased by 18.6% compared to 2022.
As a result of fair value adjustments, real estate assets decreased by $486.1 million ($197.6 million in Q4 2023), driven by capitalization rate expansion. The following weighted average capitalization rates were used to value the REIT's investment properties at the REIT's proportionate share(1):
December 31, 2023 | ||
• Office - Canada | 6.22 % | |
• Office - U.S. | 7.68 % | |
• Retail | 6.49 % | |
• Residential | 4.47 % | |
• Industrial | 5.30 % |
Overall portfolio occupancy was 96.5% at December 31, 2023.
Unitholders' equity per Unit was $19.83 and Net Asset Value ("NAV") per Unit(3) was $20.75 at December 31, 2023.
Liquidity was in excess of $950 million at December 31, 2023.
(1) | These are non-GAAP measures. Refer to the "Non-GAAP Measures" section of this news release. |
(2) | Debt includes mortgages payable, debentures payable, unsecured term loans, lines of credit and liabilities classified as held for sale. |
(3) | These are non-GAAP ratios. Refer to the "Non-GAAP Measures" section of this news release. |
(4) | Unencumbered assets are investment properties and properties under development without encumbrances for mortgages or lines of credit. Unsecured debt includes debentures payable, unsecured term loans and unsecured lines of credit. |
(5) | Adjusted earnings before interest, taxes, depreciation and amortization ("Adjusted EBITDA") is calculated by taking the sum of net operating income (excluding straight-lining of contractual rent, IFRIC 21, as well as the Bow and 100 Wynford non-cash rental adjustments) and finance income and subtracting trust expenses (excluding the fair value adjustment to unit-based compensation) for the last 12 months. Refer to the "Non-GAAP Measures" section of this news release. |
FINANCIAL HIGHLIGHTS
December 31 | December 31 | |
2023 | 2022 | |
Total assets (in thousands) | $10,777,643 | $11,412,603 |
Debt to total assets per the REIT's Financial Statements(1) | 34.2 % | 34.4 % |
Debt to total assets at the REIT's proportionate share(1)(2) | 44.0 % | 44.0 % |
Debt to Adjusted EBITDA at the REIT's proportionate share(1)(2)(3) | 8.5 | 9.6 |
Unitholders' equity (in thousands) | $5,192,375 | $5,487,287 |
Units outstanding (in thousands) | 261,868 | 265,885 |
Exchangeable units outstanding (in thousands) | 17,974 | 17,974 |
Unitholders' equity per Unit | $19.83 | $20.64 |
NAV per Unit(2) | $20.75 | $21.80 |
3 months ended December 31 | Year ended December 31 | |||
2023 | 2022 | 2023 | 2022 | |
Rentals from investment properties (in millions) | $205.9 | $216.8 | $847.1 | $834.6 |
Net operating income (in millions) | $147.4 | $148.1 | $546.6 | $534.9 |
Same-Property net operating income (cash basis) (in millions)(4) | $127.7 | $121.4 | $507.6 | $460.3 |
Net income from equity accounted investments (in millions) | $145.3 | $53.5 | $145.5 | $47.1 |
Fair value adjustment on real estate assets (in millions) | ($197.6) | ($224.5) | ($486.1) | $546.1 |
Net income (loss) (in millions) | ($11.3) | ($116.1) | $61.7 | $844.8 |
FFO (in millions)(4) | $83.7 | $87.9 | $373.4 | $341.2 |
Adjusted funds from operations ("AFFO") (in millions)(4) | $68.7 | $62.5 | $313.2 | $287.3 |
Weighted average number of Units and exchangeable units for FFO (in 000's) | 279,842 | 283,859 | 281,815 | 290,782 |
FFO per basic and diluted Unit(2) | $0.299 | $0.310 | $1.325 | $1.173 |
AFFO per basic and diluted Unit(2) | $0.245 | $0.220 | $1.111 | $0.988 |
Cash Distributions per Unit | $0.250 | $0.188 | $0.700 | $0.590 |
Payout ratio as a % of FFO(2) | 83.6 % | 60.6 % | 52.8 % | 50.3 % |
Payout ratio as a % of AFFO(2) | 102.0 % | 85.5 % | 63.0 % | 59.7 % |
(1) | Debt includes mortgages payable, debentures payable, unsecured term loans, lines of credit and liabilities classified as held for sale. |
(2) | These are non-GAAP ratios. Refer to the "Non-GAAP Measures" section of this news release. |
(3) | Adjusted earnings before interest, taxes, depreciation and amortization ("Adjusted EBITDA") is calculated by taking the sum of net operating income (excluding straight-lining of contractual rent, IFRIC 21, as well as the Bow and 100 Wynford non-cash rental adjustments) and finance income and subtracting trust expenses (excluding the fair value adjustment to unit-based compensation) for the last 12 months. Refer to the "Non-GAAP Measures" section of this news release. |
(4) | These are non-GAAP measures. Refer to the "Non-GAAP Measures" section of this news release. |
Included in net income, FFO and AFFO for the year ended December 31, 2023 is $30.6 million (U.S. $22.6 million) related to the proceeds on disposal of a purchase option. H&R had a mortgage receivable of approximately $37.2 million (U.S. $27.6 million) secured against industrial land in North Las Vegas, NV. In addition, H&R had an option to purchase the land. H&R sold its option to purchase the land and received repayment of its mortgage receivable from the borrower. The combined proceeds from the repayment of the mortgage receivable and the sale of the option amounted to $67.8 million (U.S. $50.2 million), which were received in August 2023. As a result, H&R recorded $30.6 million (U.S. $22.6 million) as proceeds on disposal of purchase option.
SUMMARY OF SIGNIFICANT ACTIVITY
2023 Net Operating Income Highlights:
Three months ended December 31 | Year ended December 31 | |||||
(in thousands of Canadian dollars) | 2023 | 2022 | % Change | 2023 | 2022 | % Change |
Operating Segment: | ||||||
Same-Property net operating income (cash basis) - Residential(1) | $41,606 | $37,137 | 12.0 % | $161,901 | $136,341 | 18.7 % |
Same-Property net operating income (cash basis) - Industrial(1) | 17,377 | 15,839 | 9.7 % | 68,130 | 60,566 | 12.5 % |
Same-Property net operating income (cash basis) - Office(1) | 44,536 | 43,741 | 1.8 % | 183,227 | 174,224 | 5.2 % |
Same-Property net operating income (cash basis) - Retail(1) | 24,180 | 24,697 | (2.1) % | 94,306 | 89,216 | 5.7 % |
Same-Property net operating income (cash basis)(1) | 127,699 | 121,414 | 5.2 % | 507,564 | 460,347 | 10.3 % |
Net operating income (cash basis) from Transactions at the REIT's proportionate share(1)(2) | 30,072 | 38,504 | (21.9) % | 136,609 | 159,794 | (14.5) % |
Realty taxes in accordance with IFRIC 21 at the REIT's proportionate share(1)(3) | 14,946 | 12,600 | 18.6 % | — | — | — % |
Straight-lining of contractual rent at the REIT's proportionate share(1) | 2,623 | 3,588 | (26.9) % | 12,100 | 6,890 | 75.6 % |
Net operating income from equity accounted investments(1) | (27,980) | (27,994) | 0.1 % | (109,669) | (92,082) | (19.1) % |
Net operating income per the REIT's Financial Statements | $147,360 | $148,112 | (0.5) % | $546,604 | $534,949 | 2.2 % |
(1) | These are non-GAAP measures. Refer to the "Non-GAAP Measures" section of this news release. |
(2) | Transactions includes acquisitions, dispositions, and transfers of investment properties to or from properties under development during the two-year period ended December 31, 2023. |
(3) | Realty taxes in accordance with IFRS Interpretations Committee Interpretation 21, Levies ("IFRIC 21") relates to the timing of the liability recognition for U.S. realty taxes. By excluding the impact of IFRIC 21, U.S. realty tax expenses are evenly matched with realty tax recoveries received from tenants throughout the period. |
2023 Transaction Highlights
Property Dispositions
In January 2023, H&R sold its 50% ownership interest in a 95,225 square foot single tenanted office property in Calgary, AB for approximately $16.8 million, which was classified as held for sale as at December 31, 2022. The purchaser assumed H&R's 50% share of the outstanding mortgage payable totalling approximately $6.3 million. In addition, H&R provided a vendor take-back mortgage to the purchaser for $7.0 million bearing interest at 5.5% per annum maturing September 1, 2029.
In April 2023, H&R sold 160 Elgin Street, a 973,661 square foot office property in Ottawa, ON for $277.0 million. H&R received $67.0 million on closing and provided two vendor take-back mortgages ("VTB") to the purchaser: (i) $30.0 million which is subordinate to the first mortgage on the property, bearing interest at 4.5% per annum, maturing April 20, 2028 and (i) $180.0 million secured by a first mortgage on the property, bearing interest at 6.5% per annum, which was repaid in Q3 2023. The VTB proceeds of $180.0 million were used to repay debt, including a $125.0 million unsecured term loan, originally scheduled to mature on November 30, 2024.
In July 2023, H&R sold four single tenanted retail properties in Québec totalling 476,802 square feet for $68.0 million. The proceeds were used to repay debt and repurchase Units under the REIT's normal course issuer bid.
In August 2023, H&R sold a 85,725 square foot single tenanted office property in Temple Terrace, FL for $17.7 million (U.S. $13.3 million). The tenant's lease expired on June 30, 2023 and the property was vacant at closing.
In August 2023, H&R sold a 13,510 square foot automotive-tenanted retail property in Roswell, GA for approximately $4.7 million (U.S. $3.6 million). The property was 37.5% occupied at closing.
In October 2023, H&R sold a 92,694 square foot single tenanted office property in Dallas, TX for approximately $7.0 million (U.S. $5.1 million). The tenant had relocated its operations to another property and given notice to H&R that it was not going to renew its lease, which was scheduled to expire on December 31, 2025.
In October 2023, H&R sold a 163,936 square foot single tenanted industrial property in Philadelphia, PA for approximately $37.7 million (U.S. $27.5 million). H&R has ownership interests in two remaining industrial properties in the U.S.
In December 2023, H&R announced it had entered into an agreement to sell 25 Dockside Drive for $232.5 million to George Brown College and Halmont Properties Corporation. The property is an office property located directly on the waterfront in downtown Toronto, comprising 479,437 square feet and is substantially leased to Corus Entertainment. The sale is expected to close in April 2024 and is subject to customary closing conditions.
Including 25 Dockside Drive, H&R's 2023 properties sold or under contract to be sold totalled $665.4 million, exceeding the disposition target of $600.0 million.
H&R's various property sales during 2023 (including properties under contract to be sold) are consistent with the REIT's strategic repositioning plan to surface significant value for unitholders, by transforming into a simplified, growth-oriented company focused on residential and industrial properties.
Q4 2023 Leasing Highlights:
In Q4 2023, H&R completed a new 10-year lease for a 39,741 square foot industrial property in Whitby, ON, at H&R's 50% ownership interest. The current tenant will be vacating in March 2024. The new tenant's lease will commence in April 2024, and annual contractual rent will increase by $5.75 per square foot. The new tenant has a free rent period for the month of April 2024.
In Q4 2023, H&R received a lease termination fee of approximately $1.8 million from Telus Communications, who vacated 114,989 square feet at H&R's 50% ownership interest at 3777 Kingsway in Burnaby, BC as part of H&R's plan to rezone this property from office to residential. Telus Communications continues to occupy 218,471 square feet at H&R's ownership interest until April 2026. IFRS 16 requires revenue from leases to be recognized on a straight-line basis over the contractual term of the lease. As a result of this lease amendment, a non-cash adjustment to straight-lining of contractual rent of ($1.7) million at H&R's ownership interest was recorded in Q4 2023.
Development Update
Canadian Properties under Development
The REIT currently has two industrial properties under development located at 1965 Meadowvale Boulevard and 1925 Meadowvale Boulevard in Mississauga, ON totalling 336,800 square feet, which are both expected to be completed in Q1 2024. The REIT expects the costs remaining to complete these two properties under development to be approximately $9.4 million. In February 2023, H&R entered into a lease agreement to fully lease 1965 Meadowvale Boulevard, totalling 187,290 square feet, for a term of 10 years at market rents with annual contractual rental escalations. In March 2023, H&R entered into a lease agreement to fully lease 1925 Meadowvale Boulevard, totalling 149,510 square feet, for a term of 12.5 years at market rents with annual contractual rental escalations.
U.S. Properties under Development
The REIT commenced construction on two U.S. residential development properties in 2022. The total development budget for these two properties is approximately $276.9 million (U.S. $209.8 million) with costs remaining to complete of approximately $118.2 million (U.S. $89.5 million). Both properties are expected to be completed on budget in the latter half of 2024.
Q4 Future Intensification Highlights
In October 2023, H&R submitted a Site Plan approval application for 6900 Maritz Drive to the City of Mississauga to replace the existing 104,689 square foot office building with a new 122,413 square foot industrial building. Demolition of the existing office building has commenced and Site Plan approval with conditions was received in January 2024. Construction is expected to commence in Spring 2024.
Normal Course Issuer Bid
During the year ended December 31, 2023, the REIT purchased and cancelled 4,147,200 Units at a weighted average price of $10.30 per Unit, for a total cost of $42.7 million, representing an approximate 50.4% discount to NAV per Unit (a non-GAAP ratio, refer to the "Non-GAAP Measures" section of this news release).
2023 Cash Distributions
H&R's cash distributions amounted to $0.70 per Unit during 2023 (2022 - $0.59 per Unit) which comprised: (i) monthly cash distributions in aggregate of $0.60 per Unit (2022 - $0.54 per Unit); and (ii) a special cash distribution of $0.10 per Unit, further described below (2022 - $0.05 per Unit).
For the year ended December 31, 2023, H&R's payout ratio as a % of AFFO (a non-GAAP ratio, refer to the "Non-GAAP Measures" section of this news release) was 63.0%.
2023 Taxation Consequences for Taxable Canadian Unitholders
H&R's cash distributions amounted to $0.70 per Unit during 2023 (including a $0.10 per Unit special cash distribution to unitholders of record on December 29, 2023). The REIT also made a special distribution to unitholders of record on December 29, 2023 of $0.52 per Unit payable in additional Units, which were immediately consolidated such that there was no change in the number of outstanding Units. The cash portion of the special distribution was intended to provide liquidity to unitholders to cover all or part of an income tax obligation that may arise from the additional taxable income being distributed via the special distribution. The amount of the special distribution payable in Units ($0.52 per Unit) will increase the adjusted cost basis of unitholders' consolidated Units.
Debt & Liquidity Highlights
As at December 31, 2023, debt to total assets per the REIT's Financial Statements was 34.2% compared to 34.4% as at December 31, 2022. As at December 31, 2023, debt to total assets at the REIT's proportionate share (a non-GAAP ratio, refer to the "Non-GAAP Measures" section of this news release) was 44.0%, which was the same as at December 31, 2022.
As at December 31, 2023, H&R had cash and cash equivalents of $64.1 million, $886.5 million available under its unused lines of credit and an unencumbered property pool of approximately $4.2 billion.
Subsequent to December 31, 2023, H&R redeemed all of its $350.0 million Series N Senior Debentures in January 2024, which bore interest at 3.369% per annum.
MONTHLY DISTRIBUTIONS DECLARED
H&R today declared distributions for the months of February and March scheduled as follows:
Distribution/Unit | Annualized | Record date | Distribution date | |
February 2024 | $0.05 | $0.60 | February 29, 2024 | March 15, 2024 |
March 2024 | $0.05 | $0.60 | March 28, 2024 | April 15, 2024 |
CONFERENCE CALL AND WEBCAST
Management will host a conference call to discuss the financial results of the REIT on Wednesday, February 14, 2024 at 9.30 a.m. Eastern Time. Participants can join the call by dialing 1‐888‐886‐7786 or 1‐416‐764‐8658. For those unable to participate in the conference call at the scheduled time, a replay will be available approximately one hour following completion of the call. To access the archived conference call by telephone, dial 1‐416‐764‐8692 or 1‐877‐674‐7070 and enter the passcode 698509 followed by the "#" key. The telephone replay will be available until Wednesday, February 21, 2024 at midnight.
A live audio webcast will be available through www.hr-reit.com/investor-relations/#investor-events. Please connect at least 15 minutes prior to the conference call to ensure adequate time for any software download that may be required to join the webcast. The webcast will be archived on H&R's website following the call date.
The investor presentation is available on H&R's website at www.hr-reit.com/investor-relations/#investor-presentation.
About H&R REIT
H&R REIT is one of Canada's largest real estate investment trusts with total assets of approximately $10.8 billion as at December 31, 2023. H&R REIT has ownership interests in a North American portfolio comprised of high-quality residential, industrial, office and retail properties comprising over 26.9 million square feet. H&R's strategy is to create a simplified, growth-oriented business focused on residential and industrial properties in order to create sustainable long term value for unitholders. H&R plans to sell its office and retail properties as market conditions permit. H&R's target is to be a leading owner, operator and developer of residential and industrial properties, creating value through redevelopment and greenfield development in prime locations within Toronto, Montreal, Vancouver, and high growth U.S. sunbelt and gateway cities.
Forward-Looking Disclaimer
Certain information in this news release contains forward‐looking information within the meaning of applicable securities laws (also known as forward‐looking statements) including, among others, statements made or implied under the heading "Summary of Significant Activity" relating to H&R's objectives, beliefs, plans, estimates, targets, projections and intentions and similar statements concerning anticipated future events, results, circumstances, performance or expectations that are not historical facts, including with respect to H&R's future plans and targets, the REIT's ability to take advantage of value-creating opportunities, the REIT's strategic repositioning plan to surface significant value for unitholders, H&R's strategy to grow its exposure to residential assets in U.S. sunbelt and gateway cities, leasing of the REIT's investment properties, including expected lease expiration dates, the sale of H&R's Dockside property, H&R's expectations with respect to the activities of its development properties, including the building of new properties, the use of such properties, the timing of construction and completion, expected construction plans and costs, anticipated square footage, expected approvals and the timing thereof, future intensification opportunities; capitalization rates and cash flow models used to estimate fair values, expectations regarding future operating fundamentals, management's expectations regarding future distributions by the REIT, and management's expectation to be able to meet all of the REIT's ongoing obligations. Forward‐looking statements generally can be identified by words such as "outlook", "objective", "may", "will", "expect", "intend", "estimate", "anticipate", "believe", "should", "plans", "project", "budget" or "continue" or similar expressions suggesting future outcomes or events. Such forward‐looking statements reflect H&R's current beliefs and are based on information currently available to management.
Forward‐looking statements are provided for the purpose of presenting information about management's current expectations and plans relating to the future and readers are cautioned that such statements may not be appropriate for other purposes. These statements are not guarantees of future performance and are based on H&R's estimates and assumptions that are subject to risks, uncertainties and other factors including those risks and uncertainties discussed in H&R's materials filed with the Canadian securities regulatory authorities from time to time, which could cause the actual results, performance or achievements of H&R to differ materially from the forward‐looking statements contained in this news release. Material factors or assumptions that were applied in drawing a conclusion or making an estimate set out in the forward‐looking statements include assumptions relating to the general economy, including the effects of increased inflation; debt markets continue to provide access to capital at a reasonable cost, notwithstanding rising interest rates; and assumptions concerning currency exchange and interest rates. Additional risks and uncertainties include, among other things, risks related to: real property ownership; the current economic environment; credit risk and tenant concentration; lease rollover risk; interest rate and other debt‐related risk; development risks; residential rental risk; capital expenditures risk; currency risk; liquidity risk; risks associated with disease outbreaks; cyber security risk; financing credit risk; ESG and climate change risk; co‐ownership interest in properties; general uninsured losses; joint arrangement and investment risks; dependence on key personnel and succession planning; potential acquisition, investment and disposition opportunities and joint venture arrangements; potential undisclosed liabilities associated with acquisitions; competition for real property investments; Unit price risk; potential conflicts of interest; availability of cash for distributions; credit ratings; ability to access capital markets; dilution; unitholder liability; redemption right risk; risks relating to debentures; tax risk; additional tax risks applicable to unitholders; investment eligibility; and statutory remedies. H&R cautions that these lists of factors, risks and uncertainties are not exhaustive. Although the forward‐looking statements contained in this news release are based upon what H&R believes are reasonable assumptions, there can be no assurance that actual results will be consistent with these forward‐looking statements.
Readers are also urged to examine H&R's materials filed with the Canadian securities regulatory authorities from time to time as they may contain discussions on risks and uncertainties which could cause the actual results and performance of H&R to differ materially from the forward‐looking statements contained in this news release. All forward‐looking statements contained in this news release are qualified by these cautionary statements. These forward‐looking statements are made as of February 13, 2024 and the REIT, except as required by applicable Canadian law, assumes no obligation to update or revise them to reflect new information or the occurrence of future events or circumstances.
Non‐GAAP Measures
The audited consolidated financial statements of the REIT and related notes for the three months and year ended December 31, 2023 (the "REIT's Financial Statements") were prepared in accordance with International Financial Reporting Standards ("IFRS"). However, H&R's management uses a number of measures, including NAV per Unit, FFO, AFFO, payout ratio as a % of FFO, payout ratio as a % of AFFO, debt to total assets at the REIT's proportionate share, debt to Adjusted EBITDA at the REIT's proportionate share, Same‐Property net operating income (cash basis) and the REIT's proportionate share, which do not have meanings recognized or standardized under IFRS or GAAP. These non‐GAAP measures and non‐GAAP ratios should not be construed as alternatives to financial measures calculated in accordance with GAAP. Further, H&R's method of calculating these supplemental non‐GAAP measures and ratios may differ from the methods of other real estate investment trusts or other issuers, and accordingly may not be comparable. H&R uses these measures to better assess H&R's underlying performance and provides these additional measures so that investors may do the same.
For information on the most directly comparable GAAP measures, composition of the measures, a description of how the REIT uses these measures and an explanation of how these measures provide useful information to investors, refer to the "Non‐GAAP Measures" section of the REIT's management's discussion and analysis as at and for the three months and year ended December 31, 2023 available at www.hr‐reit.com and on the REIT's profile on SEDAR at www.sedarplus.com, which is incorporated by reference into this news release.
Financial Position
The following table reconciles the REIT's Statement of Financial Position from the REIT's Financial Statements to the REIT's proportionate share (a non-GAAP Measure):
December 31, 2023 | December 31, 2022 | |||||
(in thousands of Canadian dollars) | REIT's Financial Statements | Equity investments | REIT's | REIT's Financial Statements | Equity investments | REIT's |
Assets | ||||||
Real estate assets | ||||||
Investment properties | $7,811,543 | $2,148,012 | $9,959,555 | $8,799,317 | $2,128,306 | $10,927,623 |
Properties under development | 1,074,819 | 135,635 | 1,210,454 | 880,778 | 89,912 | 970,690 |
8,886,362 | 2,283,647 | 11,170,009 | 9,680,095 | 2,218,218 | 11,898,313 | |
Equity accounted investments | 1,165,012 | (1,165,012) | — | 1,060,268 | (1,060,268) | — |
Assets classified as held for sale | 293,150 | — | 293,150 | 294,028 | — | 294,028 |
Other assets | 369,008 | 21,866 | 390,874 | 301,325 | 21,892 | 323,217 |
Cash and cash equivalents | 64,111 | 36,933 | 101,044 | 76,887 | 38,443 | 115,330 |
$10,777,643 | $1,177,434 | $11,955,077 | $11,412,603 | $1,218,285 | $12,630,888 | |
Liabilities and Unitholders' Equity | ||||||
Liabilities | ||||||
Debt | $3,686,833 | $1,097,839 | $4,784,672 | $3,922,529 | $1,137,210 | $5,059,739 |
Exchangeable units | 177,944 | — | 177,944 | 217,668 | — | 217,668 |
Deferred Revenue | 947,671 | — | 947,671 | 986,243 | — | 986,243 |
Deferred tax liability | 437,214 | — | 437,214 | 483,048 | — | 483,048 |
Accounts payable and accrued liabilities | 335,606 | 60,176 | 395,782 | 309,505 | 58,502 | 368,007 |
Liabilities classified as held for sale | — | — | — | 6,323 | — | 6,323 |
Non-controlling interest | — | 19,419 | 19,419 | — | 22,573 | 22,573 |
5,585,268 | 1,177,434 | 6,762,702 | 5,925,316 | 1,218,285 | 7,143,601 | |
Unitholders' equity | 5,192,375 | — | 5,192,375 | 5,487,287 | — | 5,487,287 |
$10,777,643 | $1,177,434 | $11,955,077 | $11,412,603 | $1,218,285 | $12,630,888 | |
Debt to Adjusted EBITDA at the REIT's Proportionate Share
The following table provides a reconciliation of Debt to Adjusted EBITDA at the REIT's proportionate share (a non-GAAP ratio):
December 31 | December 31 | |
2023 | 2022 | |
Debt per the REIT's Financial Statements | $3,686,833 | $3,928,852 |
Debt - REIT's proportionate share of equity accounted investments | 1,097,839 | 1,137,210 |
Debt at the REIT's proportionate share | 4,784,672 | 5,066,062 |
Years ended December 31 | 2023 | 2022 |
Net income per the REIT's Financial Statements | 61,690 | 844,823 |
Net income from equity accounted investments (within equity accounted investments) | (426) | (1,132) |
Finance costs - operations | 266,795 | 260,288 |
Fair value adjustments on financial instruments and real estate assets | 363,547 | (582,538) |
(Gain) loss on sale of real estate assets, net of related costs | 9,420 | (7,493) |
Income tax (recovery) expense | (30,484) | 101,634 |
Non-controlling interest | 1,254 | 967 |
Adjustments: | ||
The Bow and 100 Wynford non-cash rental income adjustments | (92,920) | (86,555) |
Straight-lining of contractual rent | (12,100) | (6,890) |
Fair value adjustment to unit-based compensation | (5,134) | 2,172 |
Adjusted EBITDA at the REIT's proportionate share | $561,642 | $525,276 |
Debt to Adjusted EBITDA at the REIT's proportionate share | 8.5 | 9.6 |
RESULTS OF OPERATIONS
The following table reconciles the REIT's Results of Operations from the REIT's Financial Statements to the REIT's proportionate share (a non-GAAP Measure):
Three months ended December 31, 2023 | Three months ended December 31, 2022 | |||||
(in thousands of Canadian dollars) | REIT's Financial Statements | Equity investments | REIT's | REIT's Financial Statements | Equity investments | REIT's |
Rentals from investment properties | $205,904 | $38,439 | $244,343 | $216,835 | $37,471 | $254,306 |
Property operating costs | (58,544) | (10,459) | (69,003) | (68,723) | (9,477) | (78,200) |
Net operating income | 147,360 | 27,980 | 175,340 | 148,112 | 27,994 | 176,106 |
Net income from equity accounted investments | 145,320 | (145,292) | 28 | 53,473 | (52,719) | 754 |
Finance costs - operations | (54,130) | (12,310) | (66,440) | (55,625) | (11,736) | (67,361) |
Finance income | 3,325 | 103 | 3,428 | 3,204 | 60 | 3,264 |
Trust expenses | (7,054) | (1,309) | (8,363) | (11,012) | (1,100) | (12,112) |
Fair value adjustment on financial instruments | (43,606) | 527 | (43,079) | (30,234) | 481 | (29,753) |
Fair value adjustment on real estate assets | (197,587) | 131,522 | (66,065) | (224,480) | 37,350 | (187,130) |
Loss on sale of real estate assets, net of related costs | (1,119) | (501) | (1,620) | (3,322) | (89) | (3,411) |
Net income (loss) before income taxes and non-controlling interest | (7,491) | 720 | (6,771) | (119,884) | 241 | (119,643) |
Income tax (expense) recovery | (3,822) | (14) | (3,836) | 3,755 | (18) | 3,737 |
Net income (loss) before non-controlling interest | (11,313) | 706 | (10,607) | (116,129) | 223 | (115,906) |
Non-controlling interest | — | (706) | (706) | — | (223) | (223) |
Net loss | (11,313) | — | (11,313) | (116,129) | — | (116,129) |
Other comprehensive loss: | ||||||
Items that are or may be reclassified subsequently to net loss | (130,990) | — | (130,990) | (71,875) | — | (71,875) |
Total comprehensive loss attributable to unitholders | ($142,303) | $— | ($142,303) | ($188,004) | $— | ($188,004) |
The following table reconciles the REIT's Results of Operations from the REIT's Financial Statements to the REIT's proportionate share (a non-GAAP Measure):
Year ended December 31, 2023 | Year ended December 31, 2022 | |||||
(in thousands of Canadian dollars) | REIT's Financial Statements | Equity investments | REIT's | REIT's Financial Statements | Equity investments | REIT's |
Rentals from investment properties | $847,146 | $150,704 | $997,850 | $834,640 | $130,312 | $964,952 |
Property operating costs | (300,542) | (41,035) | (341,577) | (299,691) | (38,230) | (337,921) |
Net operating income | 546,604 | 109,669 | 656,273 | 534,949 | 92,082 | 627,031 |
Net income from equity accounted investments | 145,459 | (145,033) | 426 | 47,139 | (46,007) | 1,132 |
Finance costs - operations | (218,152) | (48,643) | (266,795) | (220,262) | (40,026) | (260,288) |
Finance income | 13,849 | 341 | 14,190 | 14,793 | 88 | 14,881 |
Proceeds on disposal of purchase option | 30,568 | — | 30,568 | — | — | — |
Trust expenses | (24,385) | (4,850) | (29,235) | (22,121) | (3,242) | (25,363) |
Fair value adjustment on financial instruments | 30,555 | 856 | 31,411 | 38,349 | 2,910 | 41,259 |
Fair value adjustment on real estate assets | (486,104) | 91,146 | (394,958) | 546,081 | (4,802) | 541,279 |
Gain (loss) on sale of real estate assets, net of related costs | (7,247) | (2,173) | (9,420) | 7,332 | 161 | 7,493 |
Net income before income taxes and non-controlling interest | 31,147 | 1,313 | 32,460 | 946,260 | 1,164 | 947,424 |
Income tax (expense) recovery | 30,543 | (59) | 30,484 | (101,437) | (197) | (101,634) |
Net income before non-controlling interest | 61,690 | 1,254 | 62,944 | 844,823 | 967 | 845,790 |
Non-controlling interest | — | (1,254) | (1,254) | — | (967) | (967) |
Net income | 61,690 | — | 61,690 | 844,823 | — | 844,823 |
Other comprehensive income (loss): | ||||||
Items that are or may be reclassified subsequently to net income | (131,202) | — | (131,202) | 321,570 | — | 321,570 |
Total comprehensive income (loss) attributable to unitholders | ($69,512) | $— | ($69,512) | $1,166,393 | $— | $1,166,393 |
Same-Property net operating income (cash basis)
The following table reconciles net operating income per the REIT's Financial Statements to Same-Property net operating income (cash basis):
Three months ended December 31 | Year ended December 31 | |||||
(in thousands of Canadian dollars) | 2023 | 2022 | Change | 2023 | 2022 | Change |
Rentals from investment properties | $205,904 | $216,835 | ($10,931) | $847,146 | $834,640 | $12,506 |
Property operating costs | (58,544) | (68,723) | 10,179 | (300,542) | (299,691) | (851) |
Net operating income per the REIT's Financial Statements | 147,360 | 148,112 | (752) | 546,604 | 534,949 | 11,655 |
Adjusted for: | ||||||
Net operating income from equity accounted investments(1) | 27,980 | 27,994 | (14) | 109,669 | 92,082 | 17,587 |
Straight-lining of contractual rent at the REIT's proportionate share(1) | (2,623) | (3,588) | 965 | (12,100) | (6,890) | (5,210) |
Realty taxes in accordance with IFRIC 21 at the REIT's proportionate share(1) | (14,946) | (12,600) | (2,346) | — | — | — |
Net operating income (cash basis) from Transactions at the REIT's proportionate share(1) | (30,072) | (38,504) | 8,432 | (136,609) | (159,794) | 23,185 |
Same-Property net operating income (cash basis)(1) | $127,699 | $121,414 | $6,285 | $507,564 | $460,347 | $47,217 |
(1) | These are non-GAAP measures . Refer to the "Non-GAAP Measures" section of this news release. |
NAV per Unit (a non-GAAP Ratio)
The following table reconciles Unitholders' equity per Unit to NAV per Unit:
Unitholders' Equity per Unit and NAV per Unit | December 31 | December 31 |
(in thousands except for per Unit amounts) | 2023 | 2022 |
Unitholders' equity | $5,192,375 | $5,487,287 |
Exchangeable units | 177,944 | 217,668 |
Deferred tax liability | 437,214 | 483,048 |
Total | $5,807,533 | $6,188,003 |
Units outstanding | 261,868 | 265,885 |
Exchangeable units outstanding | 17,974 | 17,974 |
Total | 279,842 | 283,859 |
Unitholders' equity per Unit(1) | $19.83 | $20.64 |
NAV per Unit | $20.75 | $21.80 |
(1) | Unitholders' equity per Unit is calculated by dividing unitholders' equity by Units outstanding. |
Funds from Operations and Adjusted Funds from Operations
The following table reconciles net income per the REIT's Financial Statements to FFO and AFFO:
FFO AND AFFO | Three Months ended December 31 | Year ended December 31 | ||
(in thousands of Canadian dollars except per Unit amounts) | 2023 | 2022 | 2023 | 2022 |
Net income per the REIT's Financial Statements | ($11,313) | ($116,129) | $61,690 | $844,823 |
Realty taxes in accordance with IFRIC 21 | (13,762) | (11,284) | — | — |
FFO adjustments from equity accounted investments | (132,732) | (39,685) | (89,829) | 2,064 |
Exchangeable unit distributions | 4,494 | 3,368 | 12,582 | 10,692 |
Fair value adjustments on financial instruments and real estate assets | 241,193 | 254,714 | 455,549 | (584,430) |
Fair value adjustment to unit-based compensation | 529 | 6,476 | (5,134) | 2,172 |
(Gain) loss on sale of real estate assets, net of related costs | 1,119 | 3,322 | 7,247 | (7,332) |
Deferred income tax expense (recoveries) applicable to U.S. Holdco | 3,577 | (4,096) | (32,345) | 100,108 |
Incremental leasing costs | 425 | 411 | 2,163 | 2,252 |
The Bow and 100 Wynford non-cash rental income and accretion adjustments | (9,880) | (9,223) | (38,572) | (29,166) |
FFO(1) | $83,650 | $87,874 | $373,351 | $341,183 |
Straight-lining of contractual rent | (2,453) | (3,280) | (11,404) | (6,512) |
Rent amortization of tenant inducements | 1,130 | 1,209 | 4,514 | 4,691 |
Capital expenditures | (10,881) | (15,731) | (41,168) | (35,582) |
Leasing expenses and tenant inducements | (980) | (4,874) | (4,747) | (8,516) |
Incremental leasing costs | (425) | (411) | (2,163) | (2,252) |
AFFO adjustments from equity accounted investments | (1,364) | (2,304) | (5,212) | (5,676) |
AFFO(1) | $68,677 | $62,483 | $313,171 | $287,336 |
Weighted average number of Units and exchangeable units (in thousands of Units)(2) | 279,842 | 283,859 | 281,815 | 290,782 |
FFO per basic and diluted Unit(3) | $0.299 | $0.310 | $1.325 | $1.173 |
AFFO per basic and diluted Unit(3) | $0.245 | $0.220 | $1.111 | $0.988 |
Cash Distributions per Unit | $0.250 | $0.188 | $0.700 | $0.590 |
Payout ratio as a % of FFO(3) | 83.6 % | 60.6 % | 52.8 % | 50.3 % |
Payout ratio as a % of AFFO(3) | 102.0 % | 85.5 % | 63.0 % | 59.7 % |
(1) | These are non-GAAP measures defined in the "Non-GAAP Measures" section of this news release. |
(2) | For the three months and year ended December 31, 2023, included in the weighted average and diluted weighted average number of Units are exchangeable units of 17,974,186. For the three months and year ended December 31, 2022, included in the weighted average and diluted weighted average number of Units are exchangeable units of 17,974,186 and 18,110,844, respectively. |
(3) | These are non-GAAP ratios defined in the "Non-GAAP Measures" section of this news release. |
Additional information regarding H&R is available at www.hr-reit.com and on www.sedarplus.com

SOURCE H&R Real Estate Investment Trust

View original content to download multimedia: http://www.newswire.ca/en/releases/archive/February2024/13/c9892.html
