The Hackett Group, Inc.'s (NASDAQ:HCKT) Stock Been Rising: Are Strong Financials Guiding The Market?
Hackett Group's (NASDAQ:HCKT) stock up by 8.6% over the past three months. Since the market usually pay for a company’s long-term financial health, we decided to study the company’s fundamentals to see if they could be influencing the market. In this article, we decided to focus on Hackett Group's ROE.
ROE or return on equity is a useful tool to assess how effectively a company can generate returns on the investment it received from its shareholders. In other words, it is a profitability ratio which measures the rate of return on the capital provided by the company's shareholders.
Check out our latest analysis for Hackett Group
How Do You Calculate Return On Equity?
The formula for return on equity is:
Return on Equity = Net Profit (from continuing operations) ÷ Shareholders' Equity
So, based on the above formula, the ROE for Hackett Group is:
29% = US$48m ÷ US$164m (Based on the trailing twelve months to September 2022).
The 'return' is the profit over the last twelve months. Another way to think of that is that for every $1 worth of equity, the company was able to earn $0.29 in profit.
Why Is ROE Important For Earnings Growth?
So far, we've learned that ROE is a measure of a company's profitability. Based on how much of its profits the company chooses to reinvest or "retain", we are then able to evaluate a company's future ability to generate profits. Assuming all else is equal, companies that have both a higher return on equity and higher profit retention are usually the ones that have a higher growth rate when compared to companies that don't have the same features.
Hackett Group's Earnings Growth And 29% ROE
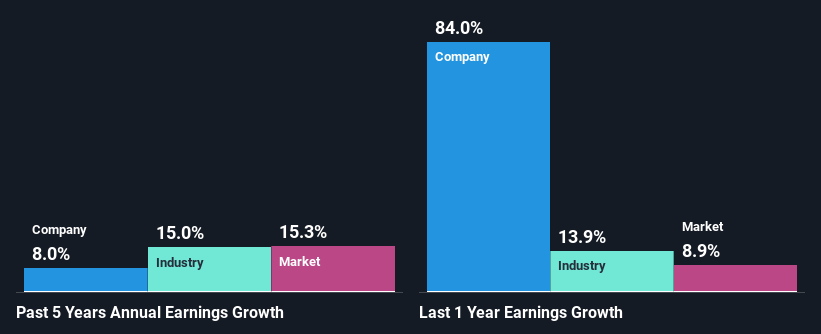
To begin with, Hackett Group has a pretty high ROE which is interesting. Additionally, the company's ROE is higher compared to the industry average of 15% which is quite remarkable. This likely paved the way for the modest 8.0% net income growth seen by Hackett Group over the past five years. growth
We then compared Hackett Group's net income growth with the industry and found that the company's growth figure is lower than the average industry growth rate of 15% in the same period, which is a bit concerning.
Earnings growth is an important metric to consider when valuing a stock. It’s important for an investor to know whether the market has priced in the company's expected earnings growth (or decline). By doing so, they will have an idea if the stock is headed into clear blue waters or if swampy waters await. One good indicator of expected earnings growth is the P/E ratio which determines the price the market is willing to pay for a stock based on its earnings prospects. So, you may want to check if Hackett Group is trading on a high P/E or a low P/E, relative to its industry.
Is Hackett Group Efficiently Re-investing Its Profits?
Hackett Group has a healthy combination of a moderate three-year median payout ratio of 48% (or a retention ratio of 52%) and a respectable amount of growth in earnings as we saw above, meaning that the company has been making efficient use of its profits.
Besides, Hackett Group has been paying dividends for at least ten years or more. This shows that the company is committed to sharing profits with its shareholders.
Summary
Overall, we are quite pleased with Hackett Group's performance. In particular, it's great to see that the company is investing heavily into its business and along with a high rate of return, that has resulted in a respectable growth in its earnings. With that said, on studying the latest analyst forecasts, we found that while the company has seen growth in its past earnings, analysts expect its future earnings to shrink. To know more about the company's future earnings growth forecasts take a look at this free report on analyst forecasts for the company to find out more.
Have feedback on this article? Concerned about the content? Get in touch with us directly. Alternatively, email editorial-team (at) simplywallst.com.
This article by Simply Wall St is general in nature. We provide commentary based on historical data and analyst forecasts only using an unbiased methodology and our articles are not intended to be financial advice. It does not constitute a recommendation to buy or sell any stock, and does not take account of your objectives, or your financial situation. We aim to bring you long-term focused analysis driven by fundamental data. Note that our analysis may not factor in the latest price-sensitive company announcements or qualitative material. Simply Wall St has no position in any stocks mentioned.
Join A Paid User Research Session
You’ll receive a US$30 Amazon Gift card for 1 hour of your time while helping us build better investing tools for the individual investors like yourself. Sign up here
