Is The Hackett Group, Inc.'s (NASDAQ:HCKT) Latest Stock Performance A Reflection Of Its Financial Health?
Hackett Group (NASDAQ:HCKT) has had a great run on the share market with its stock up by a significant 18% over the last three months. Since the market usually pay for a company’s long-term fundamentals, we decided to study the company’s key performance indicators to see if they could be influencing the market. Specifically, we decided to study Hackett Group's ROE in this article.
ROE or return on equity is a useful tool to assess how effectively a company can generate returns on the investment it received from its shareholders. Put another way, it reveals the company's success at turning shareholder investments into profits.
View our latest analysis for Hackett Group
How Do You Calculate Return On Equity?
The formula for return on equity is:
Return on Equity = Net Profit (from continuing operations) ÷ Shareholders' Equity
So, based on the above formula, the ROE for Hackett Group is:
61% = US$38m ÷ US$63m (Based on the trailing twelve months to March 2023).
The 'return' is the income the business earned over the last year. One way to conceptualize this is that for each $1 of shareholders' capital it has, the company made $0.61 in profit.
What Is The Relationship Between ROE And Earnings Growth?
So far, we've learned that ROE is a measure of a company's profitability. We now need to evaluate how much profit the company reinvests or "retains" for future growth which then gives us an idea about the growth potential of the company. Assuming all else is equal, companies that have both a higher return on equity and higher profit retention are usually the ones that have a higher growth rate when compared to companies that don't have the same features.
Hackett Group's Earnings Growth And 61% ROE
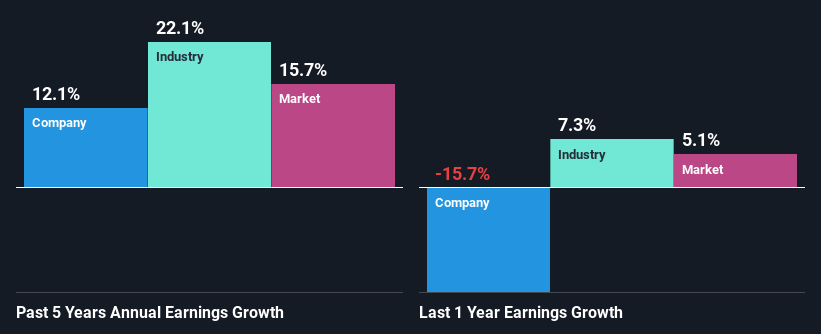
First thing first, we like that Hackett Group has an impressive ROE. Secondly, even when compared to the industry average of 18% the company's ROE is quite impressive. This probably laid the groundwork for Hackett Group's moderate 12% net income growth seen over the past five years.
We then compared Hackett Group's net income growth with the industry and found that the company's growth figure is lower than the average industry growth rate of 22% in the same 5-year period, which is a bit concerning.
Earnings growth is an important metric to consider when valuing a stock. It’s important for an investor to know whether the market has priced in the company's expected earnings growth (or decline). This then helps them determine if the stock is placed for a bright or bleak future. What is HCKT worth today? The intrinsic value infographic in our free research report helps visualize whether HCKT is currently mispriced by the market.
Is Hackett Group Using Its Retained Earnings Effectively?
With a three-year median payout ratio of 40% (implying that the company retains 60% of its profits), it seems that Hackett Group is reinvesting efficiently in a way that it sees respectable amount growth in its earnings and pays a dividend that's well covered.
Additionally, Hackett Group has paid dividends over a period of at least ten years which means that the company is pretty serious about sharing its profits with shareholders.
Summary
On the whole, we feel that Hackett Group's performance has been quite good. Particularly, we like that the company is reinvesting heavily into its business, and at a high rate of return. As a result, the decent growth in its earnings is not surprising. With that said, on studying the latest analyst forecasts, we found that while the company has seen growth in its past earnings, analysts expect its future earnings to shrink. Are these analysts expectations based on the broad expectations for the industry, or on the company's fundamentals? Click here to be taken to our analyst's forecasts page for the company.
Have feedback on this article? Concerned about the content? Get in touch with us directly. Alternatively, email editorial-team (at) simplywallst.com.
This article by Simply Wall St is general in nature. We provide commentary based on historical data and analyst forecasts only using an unbiased methodology and our articles are not intended to be financial advice. It does not constitute a recommendation to buy or sell any stock, and does not take account of your objectives, or your financial situation. We aim to bring you long-term focused analysis driven by fundamental data. Note that our analysis may not factor in the latest price-sensitive company announcements or qualitative material. Simply Wall St has no position in any stocks mentioned.
Join A Paid User Research Session
You’ll receive a US$30 Amazon Gift card for 1 hour of your time while helping us build better investing tools for the individual investors like yourself. Sign up here
