Is Hanesbrands Inc (HBI) Set to Underperform? Analyzing the Factors Limiting Growth
Long-established in the Manufacturing - Apparel & Accessories industry, Hanesbrands Inc (NYSE:HBI) has enjoyed a stellar reputation. However, it has recently witnessed a daily loss of 1.66%, juxtaposed with a three-month change of -9.86%. Fresh insights from the GF Score hint at potential headwinds. Notably, its diminished rankings in financial strength, growth, and valuation suggest that the company might not live up to its historical performance. Join us as we dive deep into these pivotal metrics to unravel the evolving narrative of Hanesbrands Inc.
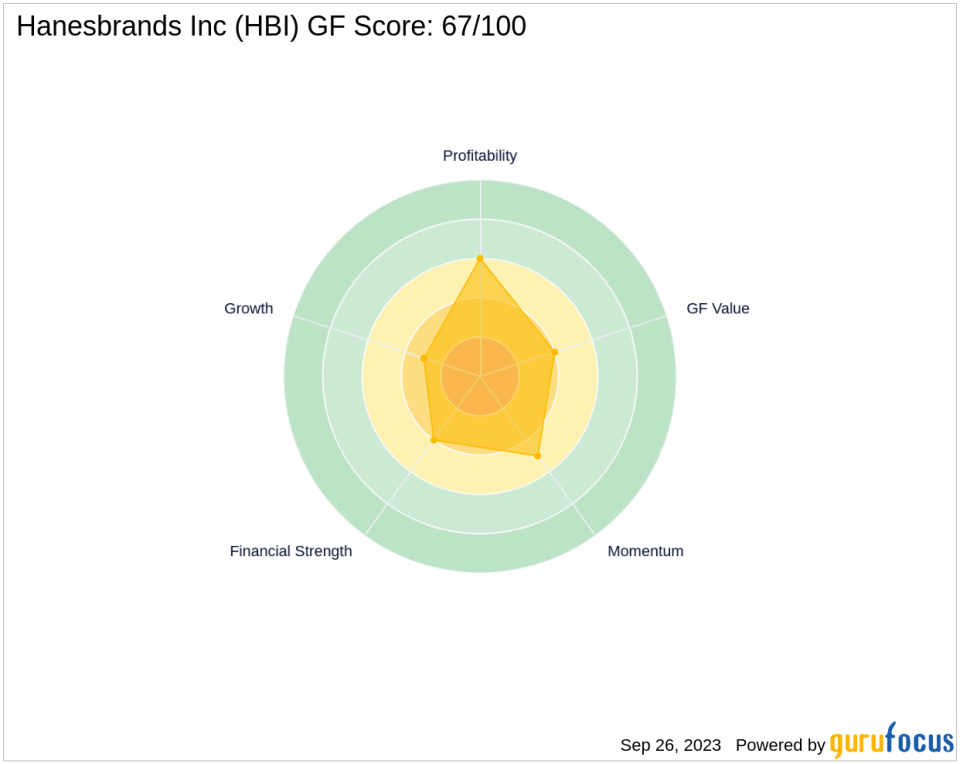
What Is the GF Score?
The GF Score is a stock performance ranking system developed by GuruFocus using five aspects of valuation, which has been found to be closely correlated to the long-term performances of stocks by backtesting from 2006 to 2021. The stocks with a higher GF Score generally generate higher returns than those with a lower GF Score. Therefore, when picking stocks, investors should invest in companies with high GF Scores. The GF Score ranges from 0 to 100, with 100 as the highest rank.
Financial strength rank: 4/10
Profitability rank: 6/10
Growth rank: 3/10
GF Value rank: 4/10
Momentum rank: 5/10
Based on the above method, GuruFocus assigned Hanesbrands Inc the GF Score of 67 out of 100, which signals poor future outperformance potential.
Understanding Hanesbrands Inc Business
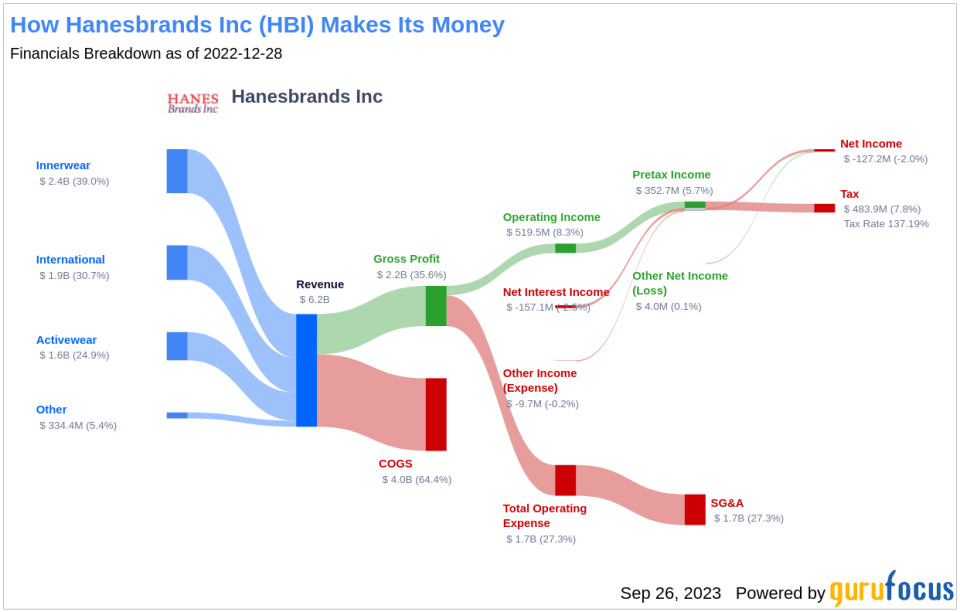
Hanesbrands Inc, with a market cap of $1.35 billion, manufactures basic and athletic apparel under brands including Hanes, Champion, Playtex, Maidenform, Bali, Berlei, and Bonds. The company sells wholesale to discount, midmarket, and department store retailers as well as direct to consumers through stores and e-commerce. Hanesbrands is vertically integrated as it produces more than 70% of its products in company-controlled factories in more than three dozen nations. Hanesbrands distributes products in the Americas, Europe, and Asia-Pacific. The company was founded in 1901 and is based in Winston-Salem, North Carolina.
Financial Strength Breakdown
Hanesbrands Inc's financial strength indicators present some concerning insights about the company's balance sheet health. The company's interest coverage ratio of 1.46 positions it worse than 82.03% of 718 companies in the Manufacturing - Apparel & Accessories industry. This ratio highlights potential challenges the company might face when handling its interest expenses on outstanding debt. It's worth noting that the esteemed investor Benjamin Graham typically favored companies with an interest coverage ratio of at least five.
The company's Altman Z-Score is just 1.59, which is below the distress zone of 1.81. This suggests that the company may face financial distress over the next few years. Additionally, the company's low cash-to-debt ratio at 0.05 indicates a struggle in handling existing debt levels.
The company's debt-to-equity ratio is 12.01, which is worse than 99.89% of 913 companies in the Manufacturing - Apparel & Accessories industry. A high debt-to-equity ratio suggests over-reliance on borrowing and vulnerability to market fluctuations. Additionally, the company's debt-to-Ebitda ratio is 10.32, which is above Joel Tillinghast's warning level of 4 and is worse than 87.08% of 774 companies in the Manufacturing - Apparel & Accessories industry. Tillinghast said in his book Big Money Think's Small: Biases, Blind Spots, and Smarter Investing that a high debt-to-Ebitda ratio can be a red flag unless tangible assets cover the debt.
Growth Prospects
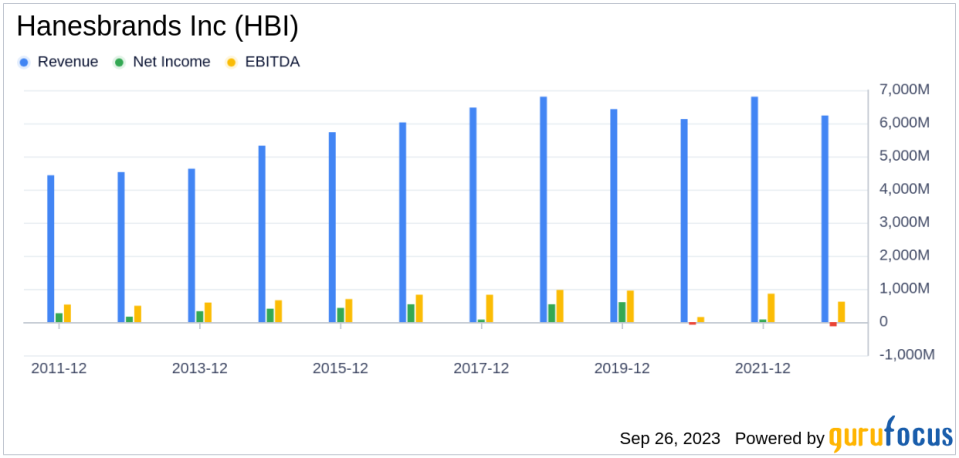
A lack of significant growth is another area where Hanesbrands Inc seems to falter, as evidenced by the company's low Growth rank. Over the past five years, Hanesbrands Inc has witnessed a decline in its earnings before interest, taxes, depreciation, and amortization (EBITDA). The three-year growth rate is recorded at -12.2, while the five-year growth rate is at -8.9. These figures underscore potential challenges in the company's profitability. Lastly, Hanesbrands Inc predictability rank is just one star out of five, adding to investor uncertainty regarding revenue and earnings consistency.
Next Steps
Given the company's financial strength, profitability, and growth metrics, the GF Score highlights the firm's unparalleled position for potential underperformance. It is crucial for investors to consider these factors when making investment decisions. GuruFocus Premium members can find more companies with strong GF Scores using the following screener link: GF Score Screen.
This article first appeared on GuruFocus.
