Hartford Financial (HIG) Q2 Earnings Beat on Commercial Lines Unit
The Hartford Financial Services Group, Inc. HIG reported second-quarter 2023 adjusted operating earnings of $1.88 per share, which outpaced the Zacks Consensus Estimate by 1.6%. However, the bottom line declined 13% year over year.
Operating revenues of HIG rose 8.3% year over year to $4,078 million in the quarter under review. Yet, the top line missed the consensus mark by a whisker.
The quarterly results benefited from well-performing Commercial Lines and Group Benefits businesses. While the Commercial Lines unit benefited on the back of higher premiums written, the Group Benefits business gained from improved fully insured ongoing premiums and sound core earnings margin. However, the upside was partly offset by elevated catastrophe losses, inflationary headwinds in personal auto business and an increased expense level.
The Hartford Financial Services Group, Inc. Price, Consensus and EPS Surprise
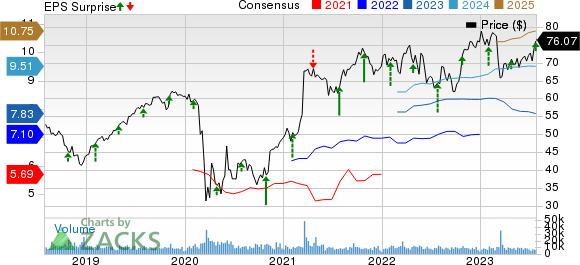
The Hartford Financial Services Group, Inc. price-consensus-eps-surprise-chart | The Hartford Financial Services Group, Inc. Quote
Q2 Operations
Net earned premiums of Hartford Financial amounted to $5,220 million, which improved 8.5% year over year in the second quarter and beat our estimate of $5,136.3 million.
Net investment income dipped 0.2% year over year to $540 million in the second quarter but surpassed our estimate of $537.4 million. The year-over-year decline was due to reduced returns from limited partnerships and other alternative investments. Net investment income witnessed year-over-year decreases across the Personal Lines and Group Benefits segments. The metric improved year over year in the remaining four segments, which are Commercial Lines, P&C Other Ops, Hartford Funds and Corporate segments.
Total benefits, losses and expenses of $5,377 million increased 11.6% year over year in the quarter under review, higher than our estimate of $5,330.7 million.
HIG reported a pretax income of $672 million, which advanced 21.3% year over year and surpassed our estimate of $658.2 million.
Segmental Update
P&C
Commercial Lines
The segment recorded revenues of $3,210 million in the second quarter, which rose 15.3% year over year. Core earnings fell 9% year over year to $493 million due to higher catastrophe losses, a decrease in net favorable prior accident year development within core earnings and an elevated loss ratio in workers' compensation. Yet, the metric came higher than our estimate of $455.4 million.
The underlying combined ratio of 88.3% deteriorated 20 basis points (bps) year over year due to an increased underlying loss and loss adjustment expense ratio.
Personal Lines
Revenues of $820 million grew 6.6% year over year in the second quarter. The segment reported a core loss of $57 million against the prior-year quarter’s core earnings of $21 million. Higher severity of auto liability and physical damage dampened the metric.
The underlying combined ratio deteriorated 760 bps year over year to 101.7% in the quarter under review.
P&C Other Ops
The segment’s revenues of $16 million more than doubled year over year in the second quarter.
Group Benefits
The segment reported revenues of $1,724 million in the quarter under review, which improved 9.3% year over year and beat our estimate of $1,681.3 million. Core earnings dropped 18% year over year to $133 million due to an elevated group life loss ratio and a decline in net investment income. The metric surpassed our estimate of $111.6 million.
The loss ratio came in at 72.1%, which deteriorated 200 bps year over year due to increased claim severities.
Hartford Funds
Revenues of $249 million dipped 0.8% over year in the second quarter but came higher than our estimate of $230.6 million. Core earnings remained flat year over year at $44 million, higher than our estimate of $33.7 million. Improved net investment income in the unit was partly offset by reduced fee income net of variable expenses.
The segment’s daily average assets under management decreased 7% year over year to $127.5 billion on the back of higher net outflows in the trailing 12 months.
Corporate
The segment’s revenues of $30 million significantly improved from the prior year's negative figure of $14 million and beat our estimate of $24.5 million. The unit reported a core loss of $35 million in the quarter under review, narrower than the prior-year quarter’s loss of $43 million, attributable to improved net investment income.
Financial Update (as of Jun 30, 2023)
Hartford Financial exited the second quarter with cash of $150 million, which decreased 34.5% from the figure at 2022 end. Total investments of $52.7 billion inched up 0.2% from the 2022-end level.
Total assets of $73.9 billion increased 1.2% from the figure at 2022 end.
Debt amounted to $4,360 million, which inched up marginally from the figure as of Dec 31, 2022.
Total stockholders’ equity rose 3.5% from the 2022-end level to $14,152 million.
Book value per share came in at $44.43 during the second quarter, up 5% year over year.
Core earnings’ return on equity in the trailing 12 months deteriorated 40 bps year over year to 13.6% at the second-quarter end.
Capital-Deployment Update
Hartford Financial returned $484 million to shareholders, which included $350 million in share buybacks and $134 million in common dividend. Under its $3-billion share repurchase program, HIG had a leftover buyback capacity of $2 billion as of Jun 30, 2023.
Outlook
Management expects to achieve cumulative savings of $625 million in 2023 from the Hartford Next program.
Zacks Rank
Hartford Financial currently has a Zacks Rank #4 (Sell).
You can see the complete list of today’s Zacks #1 Rank (Strong Buy) stocks here.
Performance of Some Other Insurers
Of the other insurance industry players that have reported second-quarter 2023 results so far, the bottom-line results of Chubb Limited CB, Arch Capital Group Ltd. ACGL and W. R. Berkley Corporation WRB beat the Zacks Consensus Estimate.
Chubb reported second-quarter 2023 core operating income of $4.92 per share, which outpaced the Zacks Consensus Estimate by 11.6%. The bottom line improved 17.1% from the year-ago quarter. Net premiums written of CB improved 9.8% year over year to $10.7 billion in the quarter. Net premiums earned rose 15.2% to $11 billion. Our estimate was $9.9 billion. Net investment income was $1.1 billion, up 28.9%. Both the Zacks Consensus Estimate as well as our estimate were pegged at $1 billion. Property and casualty underwriting income was $1.4 billion, down 5.5% from the year-ago quarter.
Arch Capital reported second-quarter 2023 operating income of $1.92 per share, beating the Zacks Consensus Estimate by 16.4%. The bottom line increased 43.3% year over year. Operating revenues of $3.2 billion rose 32.6% year over yeare. The figure beat the consensus estimate by 2.3%. Gross premiums written improved 25.2% year over year to $4.8 billion. Net premiums written of ACGL climbed 27.7% year over year to $3.4 billion on higher premiums written across its Insurance and Reinsurance segments. Net investment income increased 128.3% year over year to $242 million.
W.R. Berkley reported second-quarter 2023 operating income of $1.14 per share, which beat the Zacks Consensus Estimate by 6.5%. The bottom line increased 1.8% year over year. Net premiums written were a record $2.8 billion, up 8.7% year over year. Operating revenues of WRB came in at $2.9 billion, up 9.4% year over year. The top line however missed the consensus estimate by 1.2%. Net investment income surged 42.9% to a record $245.2 million. The combined ratio in the Insurance segment deteriorated 240 bps to 91.1.
Want the latest recommendations from Zacks Investment Research? Today, you can download 7 Best Stocks for the Next 30 Days. Click to get this free report
The Hartford Financial Services Group, Inc. (HIG) : Free Stock Analysis Report
Chubb Limited (CB) : Free Stock Analysis Report
W.R. Berkley Corporation (WRB) : Free Stock Analysis Report
Arch Capital Group Ltd. (ACGL) : Free Stock Analysis Report
