Harvey Norman Holdings' (ASX:HVN) five-year earnings growth trails the 14% YoY shareholder returns
The simplest way to invest in stocks is to buy exchange traded funds. But the truth is, you can make significant gains if you buy good quality businesses at the right price. For example, the Harvey Norman Holdings Limited (ASX:HVN) share price is up 30% in the last five years, slightly above the market return. Zooming in, the stock is actually down 1.9% in the last year.
The past week has proven to be lucrative for Harvey Norman Holdings investors, so let's see if fundamentals drove the company's five-year performance.
Check out our latest analysis for Harvey Norman Holdings
To paraphrase Benjamin Graham: Over the short term the market is a voting machine, but over the long term it's a weighing machine. One imperfect but simple way to consider how the market perception of a company has shifted is to compare the change in the earnings per share (EPS) with the share price movement.
During five years of share price growth, Harvey Norman Holdings achieved compound earnings per share (EPS) growth of 5.4% per year. That makes the EPS growth particularly close to the yearly share price growth of 5%. That suggests that the market sentiment around the company hasn't changed much over that time. Rather, the share price has approximately tracked EPS growth.
The graphic below depicts how EPS has changed over time (unveil the exact values by clicking on the image).
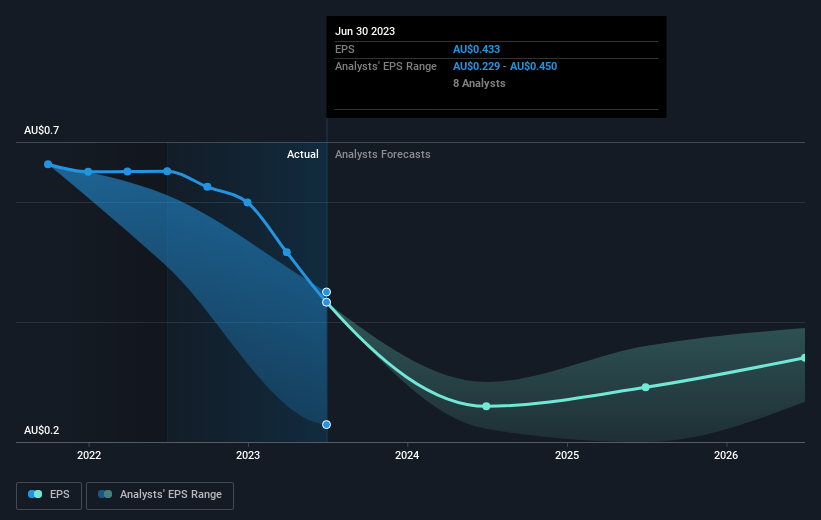
We consider it positive that insiders have made significant purchases in the last year. Even so, future earnings will be far more important to whether current shareholders make money. Before buying or selling a stock, we always recommend a close examination of historic growth trends, available here..
What About Dividends?
As well as measuring the share price return, investors should also consider the total shareholder return (TSR). The TSR incorporates the value of any spin-offs or discounted capital raisings, along with any dividends, based on the assumption that the dividends are reinvested. It's fair to say that the TSR gives a more complete picture for stocks that pay a dividend. In the case of Harvey Norman Holdings, it has a TSR of 88% for the last 5 years. That exceeds its share price return that we previously mentioned. This is largely a result of its dividend payments!
A Different Perspective
Harvey Norman Holdings shareholders gained a total return of 4.8% during the year. Unfortunately this falls short of the market return. On the bright side, the longer term returns (running at about 14% a year, over half a decade) look better. It's quite possible the business continues to execute with prowess, even as the share price gains are slowing. While it is well worth considering the different impacts that market conditions can have on the share price, there are other factors that are even more important. Consider for instance, the ever-present spectre of investment risk. We've identified 3 warning signs with Harvey Norman Holdings (at least 1 which can't be ignored) , and understanding them should be part of your investment process.
Harvey Norman Holdings is not the only stock that insiders are buying. For those who like to find winning investments this free list of growing companies with recent insider purchasing, could be just the ticket.
Please note, the market returns quoted in this article reflect the market weighted average returns of stocks that currently trade on Australian exchanges.
Have feedback on this article? Concerned about the content? Get in touch with us directly. Alternatively, email editorial-team (at) simplywallst.com.
This article by Simply Wall St is general in nature. We provide commentary based on historical data and analyst forecasts only using an unbiased methodology and our articles are not intended to be financial advice. It does not constitute a recommendation to buy or sell any stock, and does not take account of your objectives, or your financial situation. We aim to bring you long-term focused analysis driven by fundamental data. Note that our analysis may not factor in the latest price-sensitive company announcements or qualitative material. Simply Wall St has no position in any stocks mentioned.
