Harworth Group (LON:HWG) shareholders have earned a 7.0% CAGR over the last three years
By buying an index fund, investors can approximate the average market return. But if you buy good businesses at attractive prices, your portfolio returns could exceed the average market return. For example, Harworth Group plc (LON:HWG) shareholders have seen the share price rise 18% over three years, well in excess of the market decline (0.3%, not including dividends). On the other hand, the returns haven't been quite so good recently, with shareholders up just 13% , including dividends .
So let's assess the underlying fundamentals over the last 3 years and see if they've moved in lock-step with shareholder returns.
Check out our latest analysis for Harworth Group
To paraphrase Benjamin Graham: Over the short term the market is a voting machine, but over the long term it's a weighing machine. One imperfect but simple way to consider how the market perception of a company has shifted is to compare the change in the earnings per share (EPS) with the share price movement.
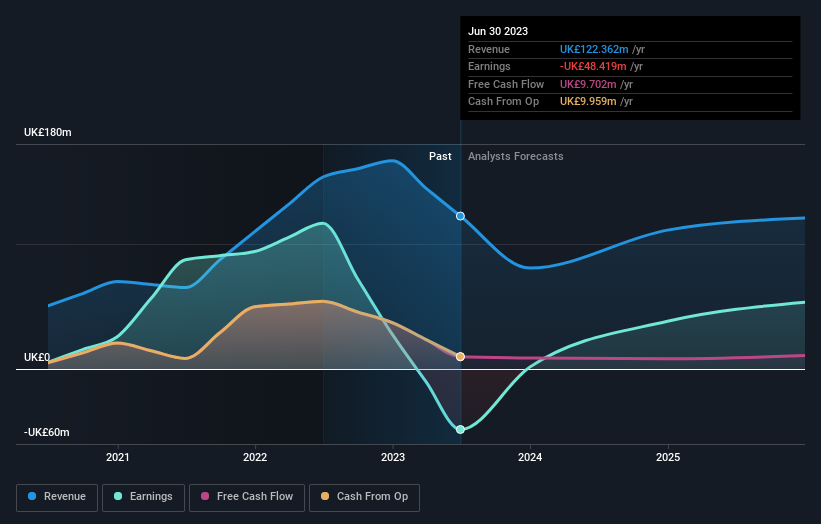
Over the last three years, Harworth Group failed to grow earnings per share, which fell 12% (annualized). This was, in part, due to extraordinary items impacting earning in the last twelve months.
Thus, it seems unlikely that the market is focussed on EPS growth at the moment. Given this situation, it makes sense to look at other metrics too.
Languishing at just 1.1%, we doubt the dividend is doing much to prop up the share price. It could be that the revenue growth of 36% per year is viewed as evidence that Harworth Group is growing. If the company is being managed for the long term good, today's shareholders might be right to hold on.
You can see how earnings and revenue have changed over time in the image below (click on the chart to see the exact values).
This free interactive report on Harworth Group's balance sheet strength is a great place to start, if you want to investigate the stock further.
What About Dividends?
As well as measuring the share price return, investors should also consider the total shareholder return (TSR). The TSR is a return calculation that accounts for the value of cash dividends (assuming that any dividend received was reinvested) and the calculated value of any discounted capital raisings and spin-offs. So for companies that pay a generous dividend, the TSR is often a lot higher than the share price return. We note that for Harworth Group the TSR over the last 3 years was 22%, which is better than the share price return mentioned above. And there's no prize for guessing that the dividend payments largely explain the divergence!
A Different Perspective
It's nice to see that Harworth Group shareholders have received a total shareholder return of 13% over the last year. That's including the dividend. Since the one-year TSR is better than the five-year TSR (the latter coming in at 2% per year), it would seem that the stock's performance has improved in recent times. Given the share price momentum remains strong, it might be worth taking a closer look at the stock, lest you miss an opportunity. Before spending more time on Harworth Group it might be wise to click here to see if insiders have been buying or selling shares.
If you are like me, then you will not want to miss this free list of growing companies that insiders are buying.
Please note, the market returns quoted in this article reflect the market weighted average returns of stocks that currently trade on British exchanges.
Have feedback on this article? Concerned about the content? Get in touch with us directly. Alternatively, email editorial-team (at) simplywallst.com.
This article by Simply Wall St is general in nature. We provide commentary based on historical data and analyst forecasts only using an unbiased methodology and our articles are not intended to be financial advice. It does not constitute a recommendation to buy or sell any stock, and does not take account of your objectives, or your financial situation. We aim to bring you long-term focused analysis driven by fundamental data. Note that our analysis may not factor in the latest price-sensitive company announcements or qualitative material. Simply Wall St has no position in any stocks mentioned.
