Hasbro (HAS) Q3 Earnings Meet, Revenues Lag, Stock Down

Hasbro, Inc. HAS reported mixed third-quarter fiscal 2023 results, wherein earnings came in line with the Zacks Consensus Estimate but revenues missed the same. The top line fell short of the consensus estimate after beating it in the preceding two quarters.
Disappointing Consumer Products and Entertainment revenues hurt the company’s top line in the quarter under discussion. Following the results, the stock declined 13% in the pre-market trading session.
Earnings & Revenues
In the fiscal third quarter, HAS reported adjusted earnings per share (EPS) of $1.64, meeting the Zacks Consensus Estimate. In the prior-year quarter, it reported adjusted EPS of $1.42.
Net revenues of $1,503.4 million lagged the Zacks Consensus Estimate of $1,637 million. Moreover, the top line declined 10% year over year.
Brand Performances
In the fiscal third quarter, Franchise Brands reported revenues of $1,011 million, up 8% year over year. The upside was driven by digital and tabletop growth for DUNGEONS & DRAGONS, MAGIC: THE GATHERING, Hasbro Gaming and TRANSFORMERS products. Our estimate was pegged at $926.8 million.
Partner Brands’ revenues dipped 35% year over year to $228.2 million due to license exits and industry softness. We expected the metric to be $334.6 million.
Revenues at Portfolio Brands came in at $170.3 million, falling 19% from the prior-year levels. A reprioritization of investment (to support Franchise Brands) and transitioning select brands to a licensing model added to the negatives. Our projection for the metric was $241.7 million.
Total gaming category revenues rose 23% year over year to $628 million.
Revenues from non-Hasbro Branded Film & TV tumbled 47% year over year to $93.9 million. We anticipated the metric to be $193.4 million.
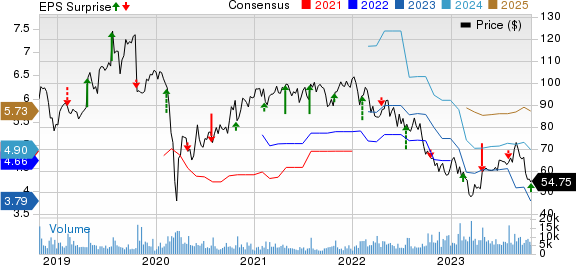
Hasbro, Inc. Price, Consensus and EPS Surprise
Hasbro, Inc. price-consensus-eps-surprise-chart | Hasbro, Inc. Quote
Segmental Revenues
Hasbro has three reportable operating segments — Consumer Products, Wizards of the Coast and Digital Gaming, and Entertainment.
In the fiscal third quarter, net revenues from Consumer Products decreased 18% year over year to $956.9 million. Adjusted operating margin was 11.2% compared with 12.6% in the prior-year quarter.
The Wizards of the Coast and Digital Gaming segment’s revenues totaled $423.6 million, up 40% from $303.5 million reported in the year-ago quarter. The uptick was driven by a rise in Digital and Licensed Gaming revenues. Adjusted operating margin was 48% compared with 33.7% in the year-ago quarter.
Entertainment’s revenues plunged 42% year over year to $122.9 million. Adjusted operating margin was 6.6% compared with 2.8% in the prior-year quarter.
Operating Highlights
In the fiscal third quarter, HAS’ cost of sales (as percentages of net revenues) came in at 32.9% compared with 35% in the year-earlier quarter. Our forecast for the metric was 32.3%.
Selling, distribution and administration expenses (as percentages of net revenues) reached 23.4% compared with 21.8% in the prior-year quarter.
HAS reported adjusted EBITDA of $401.5 million compared with $345.5 million a year ago. Our envisioned the metric to be $439.4 million.
Balance Sheet
As of Oct 1, 2023, cash and cash equivalents were $185.5 million compared with $551.6 million as of Sep 25, 2022. At the end of the reported quarter, inventories totaled $617.7 million compared with $844.5 million a year ago.
As of Oct 1, 2023, long-term debt was $3,654.6 million compared with $3,725.1 million as of Sep 25, 2022.
The company’s board of directors announced a dividend of 70 cents per common share, payable on Nov 15, to shareholders of record at the close of business as of Nov 1, 2023. In third-quarter fiscal 2023, it paid out cash dividends worth $97 million. Year to date, it has paid $291 million in dividend payments.
2023 Outlook
For fiscal 2023, management now expects revenues to decline 13-15% year over year compared with the prior estimate of 3-6% fall year over year. The company anticipates adjusted operating margin in the range of 13-13.5%. Adjusted EBITDA is suggested in the $900-$950 million band. It now projects operating cash flow in the range of $500-$600 million, down from the earlier estimate of $600-$700 million.
Segment wise, the company forecasts Consumer Products revenues to decline year over year (at cc) in the mid-to-high teens compared with the prior prediction of mid-single digits. In the Wizards of the Coast and Digital Gaming segment, management continues to expect revenues to grow in high-single digits in fiscal 2023.
In fiscal 2023, HAS continues projecting Entertainment revenues to decline 25-30% year over year.
Zacks Rank
HAS currently has a Zacks Rank #4 (Sell).
Key Picks
Some top-ranked stocks in the Zacks Consumer Discretionary sector are as follows:
Live Nation Entertainment, Inc. LYV sports a Zacks Rank #1 (Strong Buy). It has a trailing four-quarter earnings surprise of 34.6%, on average. Shares of LYV have declined 3.8% in the past year. You can see the complete list of today’s Zacks #1 Rank stocks here.
The Zacks Consensus Estimate for LYV’s 2023 sales and EPS indicates rises of 21.6% and 59.4%, respectively, from the year-ago levels.
YETI Holdings, Inc. YETI flaunts a Zacks Rank #1. YETI has a trailing four-quarter earnings surprise of 11.3% on average. The stock has gained 35% in the past year.
The Zacks Consensus Estimate for YETI’s 2024 sales and EPS implies improvements of 9.9% and 18.5%, respectively, from the prior-year levels.
OneSpaWorld Holdings Limited OSW carries a Zacks Rank #2 (Buy). OSW has a trailing four-quarter earnings surprise of 42.6% on average. Shares of OSW have increased by 10.1% in the past year.
The Zacks Consensus Estimate for OSW’s 2023 sales and EPS suggests jumps of 44.5% and 117.9%, respectively, from the year-earlier levels.
Want the latest recommendations from Zacks Investment Research? Today, you can download 7 Best Stocks for the Next 30 Days. Click to get this free report
Hasbro, Inc. (HAS) : Free Stock Analysis Report
Live Nation Entertainment, Inc. (LYV) : Free Stock Analysis Report
YETI Holdings, Inc. (YETI) : Free Stock Analysis Report
OneSpaWorld Holdings Limited (OSW) : Free Stock Analysis Report
