Here’s What Hawaiian Holdings Inc’s (NASDAQ:HA) P/E Ratio Is Telling Us

The goal of this article is to teach you how to use price to earnings ratios (P/E ratios). We’ll show how you can use Hawaiian Holdings Inc’s (NASDAQ:HA) P/E ratio to inform your assessment of the investment opportunity. Based on the last twelve months, Hawaiian Holdings’s P/E ratio is 5.35. That means that at current prices, buyers pay $5.35 for every $1 in trailing yearly profits.
View our latest analysis for Hawaiian Holdings
How Do You Calculate A P/E Ratio?
The formula for price to earnings is:
Price to Earnings Ratio = Price per Share ÷ Earnings per Share (EPS)
Or for Hawaiian Holdings:
P/E of 5.35 = $40.14 ÷ $7.51 (Based on the year to September 2018.)
Is A High P/E Ratio Good?
A higher P/E ratio implies that investors pay a higher price for the earning power of the business. All else being equal, it’s better to pay a low price — but as Warren Buffett said, ‘It’s far better to buy a wonderful company at a fair price than a fair company at a wonderful price.’
How Growth Rates Impact P/E Ratios
Earnings growth rates have a big influence on P/E ratios. That’s because companies that grow earnings per share quickly will rapidly increase the ‘E’ in the equation. Therefore, even if you pay a high multiple of earnings now, that multiple will become lower in the future. So while a stock may look expensive based on past earnings, it could be cheap based on future earnings.
Hawaiian Holdings increased earnings per share by a whopping 118% last year. And it has bolstered its earnings per share by 37% per year over the last five years. With that performance, I would expect it to have an above average P/E ratio.
How Does Hawaiian Holdings’s P/E Ratio Compare To Its Peers?
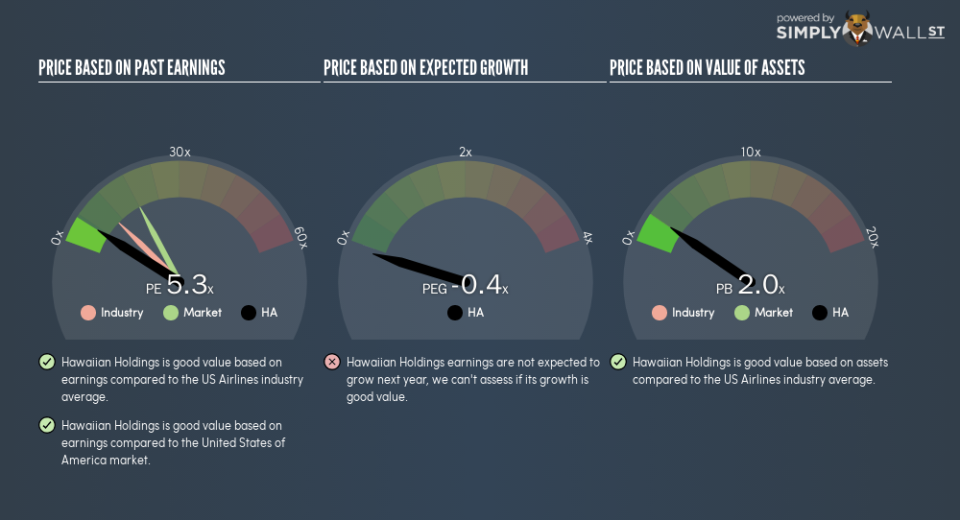
The P/E ratio indicates whether the market has higher or lower expectations of a company. If you look at the image below, you can see Hawaiian Holdings has a lower P/E than the average (10.5) in the airlines industry classification.
Its relatively low P/E ratio indicates that Hawaiian Holdings shareholders think it will struggle to do as well as other companies in its industry classification. Many investors like to buy stocks when the market is pessimistic about their prospects. It is arguably worth checking if insiders are buying shares, because that might imply they believe the stock is undervalued.
A Limitation: P/E Ratios Ignore Debt and Cash In The Bank
It’s important to note that the P/E ratio considers the market capitalization, not the enterprise value. Thus, the metric does not reflect cash or debt held by the company. Hypothetically, a company could reduce its future P/E ratio by spending its cash (or taking on debt) to achieve higher earnings.
Spending on growth might be good or bad a few years later, but the point is that the P/E ratio does not account for the option (or lack thereof).
Is Debt Impacting Hawaiian Holdings’s P/E?
Hawaiian Holdings has net debt worth just 6.4% of its market capitalization. So it doesn’t have as many options as it would with net cash, but its debt would not have much of an impact on its P/E ratio.
The Bottom Line On Hawaiian Holdings’s P/E Ratio
Hawaiian Holdings has a P/E of 5.3. That’s below the average in the US market, which is 18. The company hasn’t stretched its balance sheet, and earnings growth was good last year. The low P/E ratio suggests current market expectations are muted, implying these levels of growth will not continue.
Investors should be looking to buy stocks that the market is wrong about. If the reality for a company is not as bad as the P/E ratio indicates, then the share price should increase as the market realizes this. So this free visual report on analyst forecasts could hold they key to an excellent investment decision.
You might be able to find a better buy than Hawaiian Holdings. If you want a selection of possible winners, check out this free list of interesting companies that trade on a P/E below 20 (but have proven they can grow earnings).
To help readers see past the short term volatility of the financial market, we aim to bring you a long-term focused research analysis purely driven by fundamental data. Note that our analysis does not factor in the latest price-sensitive company announcements.
The author is an independent contributor and at the time of publication had no position in the stocks mentioned. For errors that warrant correction please contact the editor at editorial-team@simplywallst.com.
