Hawkins (NASDAQ:HWKN) rises 5.6% this week, taking five-year gains to 306%
The worst result, after buying shares in a company (assuming no leverage), would be if you lose all the money you put in. But when you pick a company that is really flourishing, you can make more than 100%. One great example is Hawkins, Inc. (NASDAQ:HWKN) which saw its share price drive 275% higher over five years. It's also up 14% in about a month.
Since it's been a strong week for Hawkins shareholders, let's have a look at trend of the longer term fundamentals.
See our latest analysis for Hawkins
There is no denying that markets are sometimes efficient, but prices do not always reflect underlying business performance. One flawed but reasonable way to assess how sentiment around a company has changed is to compare the earnings per share (EPS) with the share price.
During the five years of share price growth, Hawkins moved from a loss to profitability. That kind of transition can be an inflection point that justifies a strong share price gain, just as we have seen here. Since the company was unprofitable five years ago, but not three years ago, it's worth taking a look at the returns in the last three years, too. We can see that the Hawkins share price is up 98% in the last three years. Meanwhile, EPS is up 26% per year. This EPS growth is remarkably close to the 26% average annual increase in the share price (over three years, again). So one might argue that investor sentiment towards the stock hss not changed much over time. Arguably the share price is reflecting the earnings per share.
The graphic below depicts how EPS has changed over time (unveil the exact values by clicking on the image).
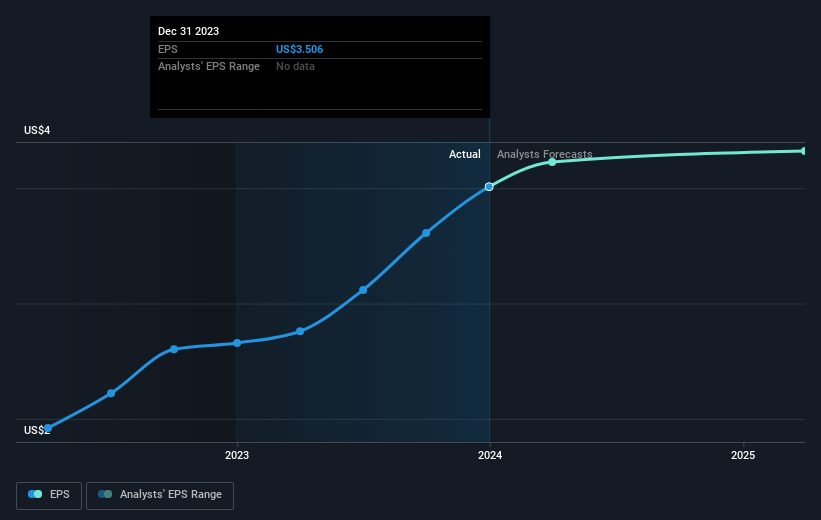
We're pleased to report that the CEO is remunerated more modestly than most CEOs at similarly capitalized companies. It's always worth keeping an eye on CEO pay, but a more important question is whether the company will grow earnings throughout the years. It might be well worthwhile taking a look at our free report on Hawkins' earnings, revenue and cash flow.
What About Dividends?
As well as measuring the share price return, investors should also consider the total shareholder return (TSR). Whereas the share price return only reflects the change in the share price, the TSR includes the value of dividends (assuming they were reinvested) and the benefit of any discounted capital raising or spin-off. So for companies that pay a generous dividend, the TSR is often a lot higher than the share price return. In the case of Hawkins, it has a TSR of 306% for the last 5 years. That exceeds its share price return that we previously mentioned. And there's no prize for guessing that the dividend payments largely explain the divergence!
A Different Perspective
We're pleased to report that Hawkins shareholders have received a total shareholder return of 80% over one year. And that does include the dividend. Since the one-year TSR is better than the five-year TSR (the latter coming in at 32% per year), it would seem that the stock's performance has improved in recent times. Someone with an optimistic perspective could view the recent improvement in TSR as indicating that the business itself is getting better with time. Is Hawkins cheap compared to other companies? These 3 valuation measures might help you decide.
We will like Hawkins better if we see some big insider buys. While we wait, check out this free list of growing companies with considerable, recent, insider buying.
Please note, the market returns quoted in this article reflect the market weighted average returns of stocks that currently trade on American exchanges.
Have feedback on this article? Concerned about the content? Get in touch with us directly. Alternatively, email editorial-team (at) simplywallst.com.
This article by Simply Wall St is general in nature. We provide commentary based on historical data and analyst forecasts only using an unbiased methodology and our articles are not intended to be financial advice. It does not constitute a recommendation to buy or sell any stock, and does not take account of your objectives, or your financial situation. We aim to bring you long-term focused analysis driven by fundamental data. Note that our analysis may not factor in the latest price-sensitive company announcements or qualitative material. Simply Wall St has no position in any stocks mentioned.
