Hayward Holdings, Inc.'s (NYSE:HAYW) Stock Has Seen Strong Momentum: Does That Call For Deeper Study Of Its Financial Prospects?
Most readers would already be aware that Hayward Holdings' (NYSE:HAYW) stock increased significantly by 14% over the past month. Given that stock prices are usually aligned with a company's financial performance in the long-term, we decided to study its financial indicators more closely to see if they had a hand to play in the recent price move. Specifically, we decided to study Hayward Holdings' ROE in this article.
ROE or return on equity is a useful tool to assess how effectively a company can generate returns on the investment it received from its shareholders. In other words, it is a profitability ratio which measures the rate of return on the capital provided by the company's shareholders.
View our latest analysis for Hayward Holdings
How Do You Calculate Return On Equity?
The formula for ROE is:
Return on Equity = Net Profit (from continuing operations) ÷ Shareholders' Equity
So, based on the above formula, the ROE for Hayward Holdings is:
5.1% = US$66m ÷ US$1.3b (Based on the trailing twelve months to September 2023).
The 'return' is the amount earned after tax over the last twelve months. One way to conceptualize this is that for each $1 of shareholders' capital it has, the company made $0.05 in profit.
Why Is ROE Important For Earnings Growth?
We have already established that ROE serves as an efficient profit-generating gauge for a company's future earnings. We now need to evaluate how much profit the company reinvests or "retains" for future growth which then gives us an idea about the growth potential of the company. Assuming all else is equal, companies that have both a higher return on equity and higher profit retention are usually the ones that have a higher growth rate when compared to companies that don't have the same features.
A Side By Side comparison of Hayward Holdings' Earnings Growth And 5.1% ROE
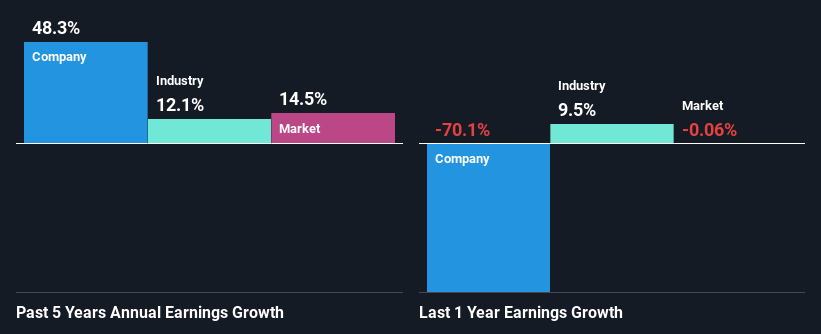
On the face of it, Hayward Holdings' ROE is not much to talk about. We then compared the company's ROE to the broader industry and were disappointed to see that the ROE is lower than the industry average of 18%. Despite this, surprisingly, Hayward Holdings saw an exceptional 48% net income growth over the past five years. We reckon that there could be other factors at play here. Such as - high earnings retention or an efficient management in place.
Next, on comparing with the industry net income growth, we found that Hayward Holdings' growth is quite high when compared to the industry average growth of 12% in the same period, which is great to see.
Earnings growth is an important metric to consider when valuing a stock. What investors need to determine next is if the expected earnings growth, or the lack of it, is already built into the share price. Doing so will help them establish if the stock's future looks promising or ominous. One good indicator of expected earnings growth is the P/E ratio which determines the price the market is willing to pay for a stock based on its earnings prospects. So, you may want to check if Hayward Holdings is trading on a high P/E or a low P/E, relative to its industry.
Is Hayward Holdings Efficiently Re-investing Its Profits?
Given that Hayward Holdings doesn't pay any dividend to its shareholders, we infer that the company has been reinvesting all of its profits to grow its business.
Summary
On the whole, we do feel that Hayward Holdings has some positive attributes. With a high rate of reinvestment, albeit at a low ROE, the company has managed to see a considerable growth in its earnings. Having said that, the company's earnings growth is expected to slow down, as forecasted in the current analyst estimates. To know more about the company's future earnings growth forecasts take a look at this free report on analyst forecasts for the company to find out more.
Have feedback on this article? Concerned about the content? Get in touch with us directly. Alternatively, email editorial-team (at) simplywallst.com.
This article by Simply Wall St is general in nature. We provide commentary based on historical data and analyst forecasts only using an unbiased methodology and our articles are not intended to be financial advice. It does not constitute a recommendation to buy or sell any stock, and does not take account of your objectives, or your financial situation. We aim to bring you long-term focused analysis driven by fundamental data. Note that our analysis may not factor in the latest price-sensitive company announcements or qualitative material. Simply Wall St has no position in any stocks mentioned.
