Can HD Supply Holdings Inc’s (HDS) ROE Continue To Surpass The Industry Average?

HD Supply Holdings Inc (NASDAQ:HDS) outperformed the Trading Companies and Distributors industry on the basis of its ROE – producing a higher 32.76% relative to the peer average of 11.18% over the past 12 months. Superficially, this looks great since we know that HDS has generated big profits with little equity capital; however, ROE doesn’t tell us how much HDS has borrowed in debt. We’ll take a closer look today at factors like financial leverage to determine whether HDS’s ROE is actually sustainable. View our latest analysis for HD Supply Holdings
Breaking down ROE — the mother of all ratios
Firstly, Return on Equity, or ROE, is simply the percentage of last years’ earning against the book value of shareholders’ equity. An ROE of 32.76% implies $0.33 returned on every $1 invested. Generally speaking, a higher ROE is preferred; however, there are other factors we must also consider before making any conclusions.
Return on Equity = Net Profit ÷ Shareholders Equity
ROE is measured against cost of equity in order to determine the efficiency of HDS’s equity capital deployed. Its cost of equity is 9.31%. Given a positive discrepancy of 23.45% between return and cost, this indicates that HDS pays less for its capital than what it generates in return, which is a sign of capital efficiency. ROE can be dissected into three distinct ratios: net profit margin, asset turnover, and financial leverage. This is called the Dupont Formula:
Dupont Formula
ROE = profit margin × asset turnover × financial leverage
ROE = (annual net profit ÷ sales) × (sales ÷ assets) × (assets ÷ shareholders’ equity)
ROE = annual net profit ÷ shareholders’ equity

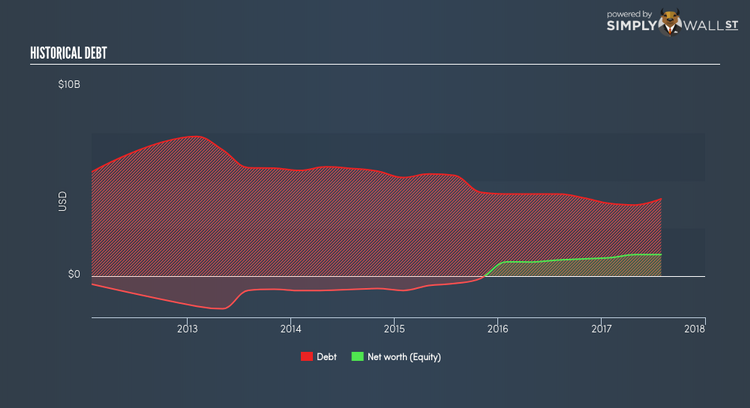
Basically, profit margin measures how much of revenue trickles down into earnings which illustrates how efficient HDS is with its cost management. Asset turnover reveals how much revenue can be generated from HDS’s asset base. Finally, financial leverage will be our main focus today. It shows how much of assets are funded by equity and can show how sustainable HDS’s capital structure is. Since ROE can be inflated by excessive debt, we need to examine HDS’s debt-to-equity level. Currently the debt-to-equity ratio stands at more than 2.5 times, which means its above-average ROE is driven by significant debt levels.
What this means for you:
Are you a shareholder? HDS exhibits a strong ROE against its peers, as well as sufficient returns to cover its cost of equity. However, its high debt level appears to be the driver of a strong ROE and is something you should be mindful of before adding more of HDS to your portfolio. If you’re looking for new ideas for high-returning stocks, you should take a look at our free platform to see the list of stocks with Return on Equity over 20%.
Are you a potential investor? If you are considering investing in HDS, looking at ROE on its own is not enough to make a well-informed decision. I recommend you do additional fundamental analysis by looking through our most recent infographic report on HD Supply Holdings to help you make a more informed investment decision.
To help readers see pass the short term volatility of the financial market, we aim to bring you a long-term focused research analysis purely driven by fundamental data. Note that our analysis does not factor in the latest price sensitive company announcements.
The author is an independent contributor and at the time of publication had no position in the stocks mentioned.
