Headlam Group (LON:HEAD) shareholders have endured a 47% loss from investing in the stock five years ago
For many, the main point of investing is to generate higher returns than the overall market. But even the best stock picker will only win with some selections. So we wouldn't blame long term Headlam Group plc (LON:HEAD) shareholders for doubting their decision to hold, with the stock down 58% over a half decade. And it's not just long term holders hurting, because the stock is down 31% in the last year. The falls have accelerated recently, with the share price down 18% in the last three months.
Since shareholders are down over the longer term, lets look at the underlying fundamentals over the that time and see if they've been consistent with returns.
See our latest analysis for Headlam Group
While markets are a powerful pricing mechanism, share prices reflect investor sentiment, not just underlying business performance. By comparing earnings per share (EPS) and share price changes over time, we can get a feel for how investor attitudes to a company have morphed over time.
Headlam Group became profitable within the last five years. Most would consider that to be a good thing, so it's counter-intuitive to see the share price declining. Other metrics may better explain the share price move.
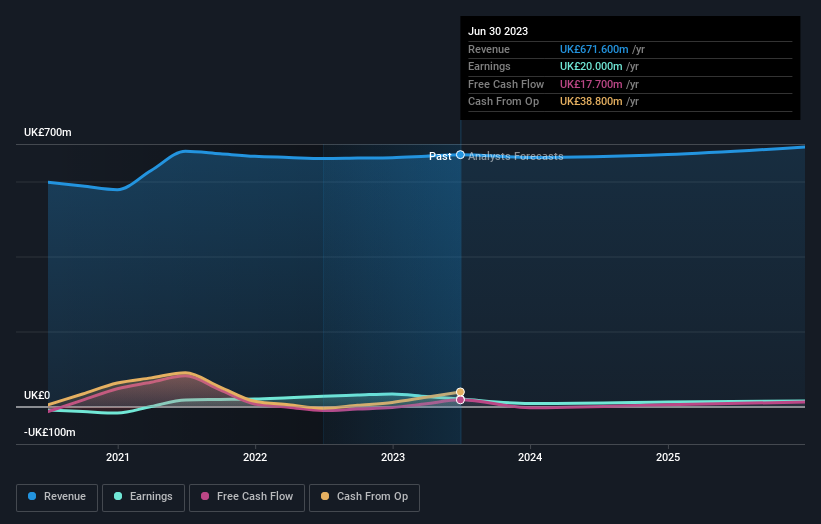
The most recent dividend was actually lower than it was in the past, so that may have sent the share price lower. The revenue decline of around 1.4% would not have helped the stock price. So it seems weak revenue and dividend trends may have influenced the share price.
The company's revenue and earnings (over time) are depicted in the image below (click to see the exact numbers).
It is of course excellent to see how Headlam Group has grown profits over the years, but the future is more important for shareholders. This free interactive report on Headlam Group's balance sheet strength is a great place to start, if you want to investigate the stock further.
What About Dividends?
It is important to consider the total shareholder return, as well as the share price return, for any given stock. Whereas the share price return only reflects the change in the share price, the TSR includes the value of dividends (assuming they were reinvested) and the benefit of any discounted capital raising or spin-off. Arguably, the TSR gives a more comprehensive picture of the return generated by a stock. In the case of Headlam Group, it has a TSR of -47% for the last 5 years. That exceeds its share price return that we previously mentioned. The dividends paid by the company have thusly boosted the total shareholder return.
A Different Perspective
Headlam Group shareholders are down 27% for the year (even including dividends), but the market itself is up 1.6%. However, keep in mind that even the best stocks will sometimes underperform the market over a twelve month period. Unfortunately, last year's performance may indicate unresolved challenges, given that it was worse than the annualised loss of 8% over the last half decade. We realise that Baron Rothschild has said investors should "buy when there is blood on the streets", but we caution that investors should first be sure they are buying a high quality business. It's always interesting to track share price performance over the longer term. But to understand Headlam Group better, we need to consider many other factors. For instance, we've identified 2 warning signs for Headlam Group (1 is concerning) that you should be aware of.
Of course Headlam Group may not be the best stock to buy. So you may wish to see this free collection of growth stocks.
Please note, the market returns quoted in this article reflect the market weighted average returns of stocks that currently trade on British exchanges.
Have feedback on this article? Concerned about the content? Get in touch with us directly. Alternatively, email editorial-team (at) simplywallst.com.
This article by Simply Wall St is general in nature. We provide commentary based on historical data and analyst forecasts only using an unbiased methodology and our articles are not intended to be financial advice. It does not constitute a recommendation to buy or sell any stock, and does not take account of your objectives, or your financial situation. We aim to bring you long-term focused analysis driven by fundamental data. Note that our analysis may not factor in the latest price-sensitive company announcements or qualitative material. Simply Wall St has no position in any stocks mentioned.
