HealthEquity (HQY) Q3 Earnings Surpass Estimates, Margins Up
HealthEquity, Inc. HQY reported adjusted earnings per share (EPS) of 60 cents in third-quarter fiscal 2024, which surpassed the Zacks Consensus Estimate by 22.5%. The bottom line improved 57.9% on a year-over-year basis.
GAAP EPS in the fiscal third quarter was 17 cents against the year-ago quarter’s loss of 2 cents.
Revenues in Detail
In the fiscal third quarter, the company generated revenues of $249.2 million, beating the Zacks Consensus Estimate by 2.3%. The top line improved 15.3% from the prior-year quarter.
HSA Details
As of Oct 31, 2023, the total number of Health Savings Accounts (HSA) for which HealthEquity served as a non-bank custodian (HSA members) was 8.3 million, up 8.4% year over year.
HealthEquity reported 592,000 HSAs with investments as of Oct 31, 2023, up 11.9% year over year. Total Accounts, as of Oct 31, 2023, were 15.3 million, up 5.4% year over year. This uptick included total HSAs and 6.9 million other Consumer Direct Benefits (CDBs).
Total HSA assets were $22.57 billion at the end of Oct 31, 2023, up 11.7% year over year. This included $13.97 billion of HSA cash and $8.59 billion of HSA investments.
This figure compares to our fiscal third-quarter HSA cash and HSA investments projection of $14.4 billion and $8.4 billion, respectively. We had projected total HSA assets of $22.8 billion in the fiscal third quarter.
Client-held funds, which are deposits held on behalf of HealthEquity’s clients to facilitate the administration of its CDBs and from which the company generates custodial revenues, were $0.76 billion as of Oct 31, 2023.
Revenue Sources
HealthEquity derives revenues from three sources: Service revenues, Custodial revenues and Interchange revenues.
Service revenues totaled $107.5 million in the quarter, down 0.9% year over year. This figure compares to our Service revenues’ fiscal third-quarter projection of $122.5 million.
Custodial revenues totaled $106.6 million, up 42.8% from the year-ago period. This figure compares to our Custodial revenues’ fiscal third-quarter projection of $80.7 million.
Interchange revenues totaled $35.1 million, up 6.9% year over year. This figure compares to our Interchange revenues’ fiscal third-quarter projection of $38 million.
HealthEquity, Inc. Price, Consensus and EPS Surprise
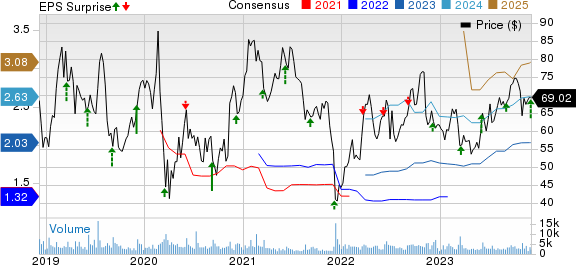
HealthEquity, Inc. price-consensus-eps-surprise-chart | HealthEquity, Inc. Quote
Margin Details
In the quarter under review, HealthEquity’s gross profit rose 24.9% to $158.4 million. The gross margin expanded 485 basis points (bps) to 63.6%.
We had projected 57.4% of gross margin for the fiscal third quarter.
Sales and marketing expenses climbed 19.7% to $13.9 million year over year, whereas technology and development expenses climbed 13.8% to $55.6 million. General and administrative expenses also increased 4.9% year over year to $26.4 million. Adjusted operating expenses of $101.6 million increased 11.4%.
Adjusted operating profit totaled $56.8 million, improving 59.5% from the prior-year quarter. Adjusted operating margin in the quarter expanded 630 bps to 22.8%.
Financial Position
The company exited third-quarter fiscal 2024 with cash and cash equivalents of $334.1 million compared with $290.3 million at the fiscal second-quarter end. Total debt (net of issuance costs) at the end of third-quarter fiscal 2024 was $874.3 million compared with $873.6 million at the end of the fiscal second quarter.
Cumulative net cash flow from operating activities at the end of third-quarter fiscal 2024 totaled $165.8 million compared with $95.2 million in the year-ago period.
FY24 Guidance
HealthEquity has upped its revenue and EPS outlook for fiscal 2024.
For fiscal 2024, revenues are now projected to be between $985 million and $995 million, up from the earlier projections of $980 million and $990 million. The Zacks Consensus Estimate is currently pegged at $990.3 million.
Adjusted EPS is now expected to be in the range of $2.08 to $2.16, up from the prior outlook of $1.97-$2.06. The Zacks Consensus Estimate currently stands at $2.03.
Our Take
HealthEquity exited third-quarter fiscal 2024 with better-than-expected results. The company witnessed solid top-line and bottom-line performances in the reported quarter. The top line benefited from robust contributions from the majority of its revenue sources. Solid growth in HSAs also drove the top line. The solid uptick in total HSA assets in the reported quarter is promising. The expansion of both margins also bodes well. The company raising its revenue and adjusted EPS outlook for the fiscal year raises our optimism.
However, a decline in Service revenues in the reported quarter is disappointing. The continued inflationary pressure leading to higher wage inflation issues does not bode well.
Zacks Rank and Other Key Picks
HealthEquity currently sports a Zacks Rank #1 (Strong Buy).
A few other top-ranked stocks in the broader medical space that have announced quarterly results are DaVita Inc. DVA, DexCom, Inc. DXCM and Integer Holdings Corporation ITGR.
DaVita, flaunting a Zacks Rank of 1, reported third-quarter 2023 adjusted EPS of $2.85, beating the Zacks Consensus Estimate by 48.4%. Revenues of $3.12 billion outpaced the consensus mark by 3.7%. You can see the complete list of today’s Zacks #1 Rank stocks here.
DaVita has a long-term estimated growth rate of 18.3%. DVA’s earnings surpassed estimates in all the trailing four quarters, the average surprise being 36.6%.
DexCom reported third-quarter 2023 adjusted EPS of 50 cents, beating the Zacks Consensus Estimate by 47.1%. Revenues of $975 million surpassed the Zacks Consensus Estimate by 4%. It currently carries a Zacks Rank #2 (Buy).
DexCom has a long-term estimated growth rate of 33.6%. DXCM’s earnings surpassed estimates in all the trailing four quarters, the average surprise being 36.4%.
Integer Holdings reported third-quarter 2023 adjusted EPS of $1.27, beating the Zacks Consensus Estimate by 20.9%. Revenues of $404.7 million surpassed the Zacks Consensus Estimate by 8.7%. It currently sports a Zacks Rank #1.
Integer Holdings has a long-term estimated growth rate of 15.8%. ITGR’s earnings surpassed estimates in all the trailing four quarters, the average surprise being 11.9%.
Want the latest recommendations from Zacks Investment Research? Today, you can download 7 Best Stocks for the Next 30 Days. Click to get this free report
DaVita Inc. (DVA) : Free Stock Analysis Report
DexCom, Inc. (DXCM) : Free Stock Analysis Report
HealthEquity, Inc. (HQY) : Free Stock Analysis Report
Integer Holdings Corporation (ITGR) : Free Stock Analysis Report
