Is Healthia Limited's(ASX:HLA) Recent Stock Performance Tethered To Its Strong Fundamentals?
Most readers would already be aware that Healthia's (ASX:HLA) stock increased significantly by 37% over the past three months. Since the market usually pay for a company’s long-term fundamentals, we decided to study the company’s key performance indicators to see if they could be influencing the market. Specifically, we decided to study Healthia's ROE in this article.
Return on Equity or ROE is a test of how effectively a company is growing its value and managing investors’ money. In short, ROE shows the profit each dollar generates with respect to its shareholder investments.
View our latest analysis for Healthia
How Is ROE Calculated?
Return on equity can be calculated by using the formula:
Return on Equity = Net Profit (from continuing operations) ÷ Shareholders' Equity
So, based on the above formula, the ROE for Healthia is:
13% = AU$11m ÷ AU$91m (Based on the trailing twelve months to December 2020).
The 'return' is the income the business earned over the last year. So, this means that for every A$1 of its shareholder's investments, the company generates a profit of A$0.13.
What Has ROE Got To Do With Earnings Growth?
Thus far, we have learned that ROE measures how efficiently a company is generating its profits. We now need to evaluate how much profit the company reinvests or "retains" for future growth which then gives us an idea about the growth potential of the company. Generally speaking, other things being equal, firms with a high return on equity and profit retention, have a higher growth rate than firms that don’t share these attributes.
Healthia's Earnings Growth And 13% ROE
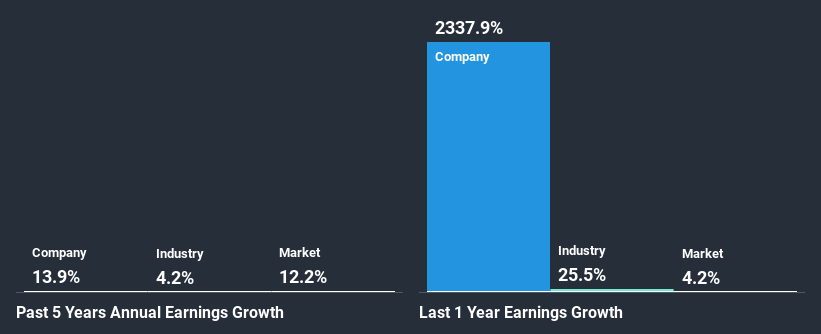
To begin with, Healthia seems to have a respectable ROE. On comparing with the average industry ROE of 9.9% the company's ROE looks pretty remarkable. This probably laid the ground for Healthia's moderate 14% net income growth seen over the past five years.
We then compared Healthia's net income growth with the industry and we're pleased to see that the company's growth figure is higher when compared with the industry which has a growth rate of 4.2% in the same period.
The basis for attaching value to a company is, to a great extent, tied to its earnings growth. What investors need to determine next is if the expected earnings growth, or the lack of it, is already built into the share price. By doing so, they will have an idea if the stock is headed into clear blue waters or if swampy waters await. One good indicator of expected earnings growth is the P/E ratio which determines the price the market is willing to pay for a stock based on its earnings prospects. So, you may want to check if Healthia is trading on a high P/E or a low P/E, relative to its industry.
Is Healthia Using Its Retained Earnings Effectively?
Healthia has a healthy combination of a moderate three-year median payout ratio of 40% (or a retention ratio of 60%) and a respectable amount of growth in earnings as we saw above, meaning that the company has been making efficient use of its profits.
While Healthia has seen growth in its earnings, it only recently started to pay a dividend. It is most likely that the company decided to impress new and existing shareholders with a dividend. Based on the latest analysts' estimates, we found that the company's future payout ratio over the next three years is expected to hold steady at 37%. As a result, Healthia's ROE is not expected to change by much either, which we inferred from the analyst estimate of 12% for future ROE.
Summary
Overall, we are quite pleased with Healthia's performance. Particularly, we like that the company is reinvesting heavily into its business, and at a high rate of return. Unsurprisingly, this has led to an impressive earnings growth. With that said, the latest industry analyst forecasts reveal that the company's earnings are expected to accelerate. To know more about the latest analysts predictions for the company, check out this visualization of analyst forecasts for the company.
This article by Simply Wall St is general in nature. It does not constitute a recommendation to buy or sell any stock, and does not take account of your objectives, or your financial situation. We aim to bring you long-term focused analysis driven by fundamental data. Note that our analysis may not factor in the latest price-sensitive company announcements or qualitative material. Simply Wall St has no position in any stocks mentioned.
Have feedback on this article? Concerned about the content? Get in touch with us directly. Alternatively, email editorial-team (at) simplywallst.com.
