Hello Group Inc.'s (NASDAQ:MOMO) Intrinsic Value Is Potentially 75% Above Its Share Price
Key Insights
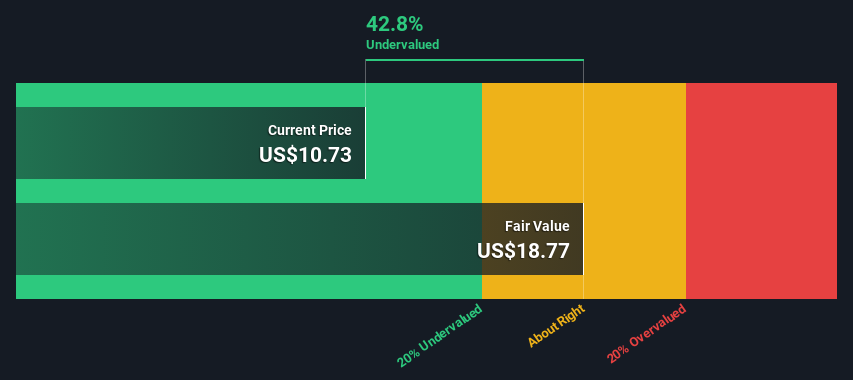
Hello Group's estimated fair value is US$18.77 based on 2 Stage Free Cash Flow to Equity
Hello Group's US$10.73 share price signals that it might be 43% undervalued
The CN¥11.92 analyst price target for MOMO is 36% less than our estimate of fair value
Does the July share price for Hello Group Inc. (NASDAQ:MOMO) reflect what it's really worth? Today, we will estimate the stock's intrinsic value by estimating the company's future cash flows and discounting them to their present value. We will take advantage of the Discounted Cash Flow (DCF) model for this purpose. Before you think you won't be able to understand it, just read on! It's actually much less complex than you'd imagine.
Companies can be valued in a lot of ways, so we would point out that a DCF is not perfect for every situation. If you still have some burning questions about this type of valuation, take a look at the Simply Wall St analysis model.
Check out our latest analysis for Hello Group
The Method
We use what is known as a 2-stage model, which simply means we have two different periods of growth rates for the company's cash flows. Generally the first stage is higher growth, and the second stage is a lower growth phase. In the first stage we need to estimate the cash flows to the business over the next ten years. Where possible we use analyst estimates, but when these aren't available we extrapolate the previous free cash flow (FCF) from the last estimate or reported value. We assume companies with shrinking free cash flow will slow their rate of shrinkage, and that companies with growing free cash flow will see their growth rate slow, over this period. We do this to reflect that growth tends to slow more in the early years than it does in later years.
A DCF is all about the idea that a dollar in the future is less valuable than a dollar today, so we need to discount the sum of these future cash flows to arrive at a present value estimate:
10-year free cash flow (FCF) forecast
2024 | 2025 | 2026 | 2027 | 2028 | 2029 | 2030 | 2031 | 2032 | 2033 | |
Levered FCF (CN¥, Millions) | CN¥2.23b | CN¥2.22b | CN¥2.22b | CN¥2.24b | CN¥2.26b | CN¥2.30b | CN¥2.33b | CN¥2.38b | CN¥2.42b | CN¥2.47b |
Growth Rate Estimate Source | Analyst x6 | Analyst x6 | Est @ 0.20% | Est @ 0.77% | Est @ 1.17% | Est @ 1.45% | Est @ 1.65% | Est @ 1.79% | Est @ 1.89% | Est @ 1.95% |
Present Value (CN¥, Millions) Discounted @ 10% | CN¥2.0k | CN¥1.8k | CN¥1.7k | CN¥1.5k | CN¥1.4k | CN¥1.3k | CN¥1.2k | CN¥1.1k | CN¥999 | CN¥923 |
("Est" = FCF growth rate estimated by Simply Wall St)
Present Value of 10-year Cash Flow (PVCF) = CN¥14b
After calculating the present value of future cash flows in the initial 10-year period, we need to calculate the Terminal Value, which accounts for all future cash flows beyond the first stage. The Gordon Growth formula is used to calculate Terminal Value at a future annual growth rate equal to the 5-year average of the 10-year government bond yield of 2.1%. We discount the terminal cash flows to today's value at a cost of equity of 10%.
Terminal Value (TV)= FCF2033 × (1 + g) ÷ (r – g) = CN¥2.5b× (1 + 2.1%) ÷ (10%– 2.1%) = CN¥31b
Present Value of Terminal Value (PVTV)= TV / (1 + r)10= CN¥31b÷ ( 1 + 10%)10= CN¥11b
The total value, or equity value, is then the sum of the present value of the future cash flows, which in this case is CN¥25b. The last step is to then divide the equity value by the number of shares outstanding. Compared to the current share price of US$10.7, the company appears quite undervalued at a 43% discount to where the stock price trades currently. Valuations are imprecise instruments though, rather like a telescope - move a few degrees and end up in a different galaxy. Do keep this in mind.
Important Assumptions
Now the most important inputs to a discounted cash flow are the discount rate, and of course, the actual cash flows. You don't have to agree with these inputs, I recommend redoing the calculations yourself and playing with them. The DCF also does not consider the possible cyclicality of an industry, or a company's future capital requirements, so it does not give a full picture of a company's potential performance. Given that we are looking at Hello Group as potential shareholders, the cost of equity is used as the discount rate, rather than the cost of capital (or weighted average cost of capital, WACC) which accounts for debt. In this calculation we've used 10%, which is based on a levered beta of 1.148. Beta is a measure of a stock's volatility, compared to the market as a whole. We get our beta from the industry average beta of globally comparable companies, with an imposed limit between 0.8 and 2.0, which is a reasonable range for a stable business.
SWOT Analysis for Hello Group
Strength
Debt is not viewed as a risk.
Dividend is in the top 25% of dividend payers in the market.
Weakness
No major weaknesses identified for MOMO.
Opportunity
Annual earnings are forecast to grow for the next 3 years.
Good value based on P/E ratio and estimated fair value.
Threat
Annual earnings are forecast to grow slower than the American market.
Looking Ahead:
Valuation is only one side of the coin in terms of building your investment thesis, and it is only one of many factors that you need to assess for a company. It's not possible to obtain a foolproof valuation with a DCF model. Preferably you'd apply different cases and assumptions and see how they would impact the company's valuation. If a company grows at a different rate, or if its cost of equity or risk free rate changes sharply, the output can look very different. Can we work out why the company is trading at a discount to intrinsic value? For Hello Group, we've put together three fundamental aspects you should look at:
Risks: Consider for instance, the ever-present spectre of investment risk. We've identified 1 warning sign with Hello Group , and understanding it should be part of your investment process.
Future Earnings: How does MOMO's growth rate compare to its peers and the wider market? Dig deeper into the analyst consensus number for the upcoming years by interacting with our free analyst growth expectation chart.
Other High Quality Alternatives: Do you like a good all-rounder? Explore our interactive list of high quality stocks to get an idea of what else is out there you may be missing!
PS. Simply Wall St updates its DCF calculation for every American stock every day, so if you want to find the intrinsic value of any other stock just search here.
Have feedback on this article? Concerned about the content? Get in touch with us directly. Alternatively, email editorial-team (at) simplywallst.com.
This article by Simply Wall St is general in nature. We provide commentary based on historical data and analyst forecasts only using an unbiased methodology and our articles are not intended to be financial advice. It does not constitute a recommendation to buy or sell any stock, and does not take account of your objectives, or your financial situation. We aim to bring you long-term focused analysis driven by fundamental data. Note that our analysis may not factor in the latest price-sensitive company announcements or qualitative material. Simply Wall St has no position in any stocks mentioned.
Join A Paid User Research Session
You’ll receive a US$30 Amazon Gift card for 1 hour of your time while helping us build better investing tools for the individual investors like yourself. Sign up here
