Here's What Crawford & Company's (NYSE:CRD.B) Shareholder Ownership Structure Looks Like
The big shareholder groups in Crawford & Company (NYSE:CRD.B) have power over the company. Institutions will often hold stock in bigger companies, and we expect to see insiders owning a noticeable percentage of the smaller ones. I quite like to see at least a little bit of insider ownership. As Charlie Munger said 'Show me the incentive and I will show you the outcome.
Crawford is not a large company by global standards. It has a market capitalization of US$386m, which means it wouldn't have the attention of many institutional investors. Our analysis of the ownership of the company, below, shows that institutional investors have bought into the company. Let's take a closer look to see what the different types of shareholders can tell us about Crawford.
See our latest analysis for Crawford
What Does The Institutional Ownership Tell Us About Crawford?
Institutional investors commonly compare their own returns to the returns of a commonly followed index. So they generally do consider buying larger companies that are included in the relevant benchmark index.
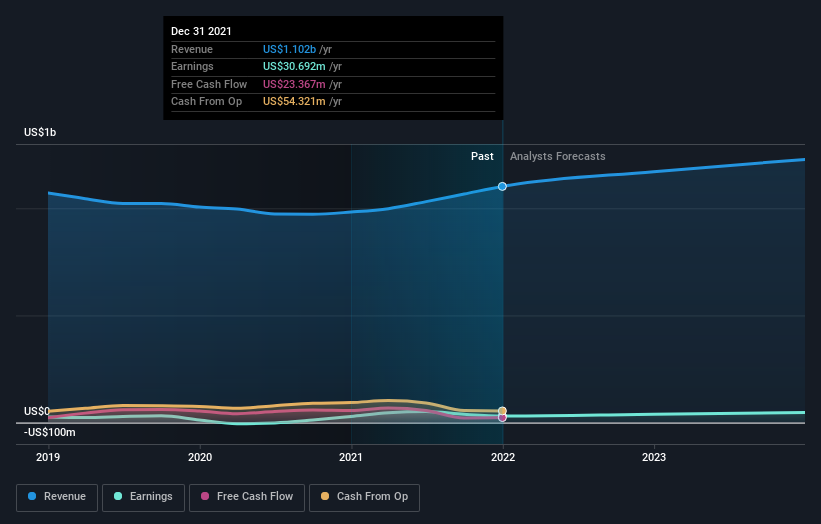
As you can see, institutional investors have a fair amount of stake in Crawford. This suggests some credibility amongst professional investors. But we can't rely on that fact alone since institutions make bad investments sometimes, just like everyone does. It is not uncommon to see a big share price drop if two large institutional investors try to sell out of a stock at the same time. So it is worth checking the past earnings trajectory of Crawford, (below). Of course, keep in mind that there are other factors to consider, too.
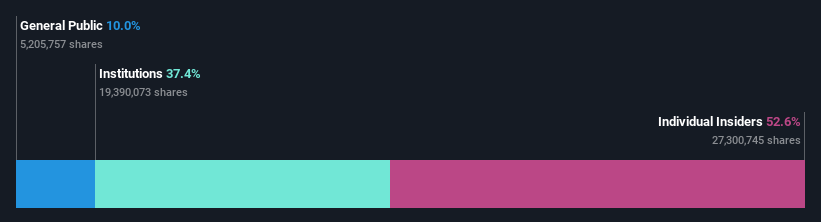
Hedge funds don't have many shares in Crawford. Jesse Crawford is currently the company's largest shareholder with 45% of shares outstanding. For context, the second largest shareholder holds about 6.9% of the shares outstanding, followed by an ownership of 5.3% by the third-largest shareholder.
After doing some more digging, we found that the top 2 shareholders collectively control more than half of the company's shares, implying that they have considerable power to influence the company's decisions.
While it makes sense to study institutional ownership data for a company, it also makes sense to study analyst sentiments to know which way the wind is blowing. Quite a few analysts cover the stock, so you could look into forecast growth quite easily.
Insider Ownership Of Crawford
The definition of an insider can differ slightly between different countries, but members of the board of directors always count. Management ultimately answers to the board. However, it is not uncommon for managers to be executive board members, especially if they are a founder or the CEO.
Most consider insider ownership a positive because it can indicate the board is well aligned with other shareholders. However, on some occasions too much power is concentrated within this group.
Our information suggests that insiders own more than half of Crawford & Company. This gives them effective control of the company. Given it has a market cap of US$386m, that means they have US$203m worth of shares. It is good to see this level of investment. You can check here to see if those insiders have been buying recently.
General Public Ownership
With a 10% ownership, the general public, mostly comprising of individual investors, have some degree of sway over Crawford. While this size of ownership may not be enough to sway a policy decision in their favour, they can still make a collective impact on company policies.
Next Steps:
While it is well worth considering the different groups that own a company, there are other factors that are even more important. Case in point: We've spotted 2 warning signs for Crawford you should be aware of.
Ultimately the future is most important. You can access this free report on analyst forecasts for the company.
NB: Figures in this article are calculated using data from the last twelve months, which refer to the 12-month period ending on the last date of the month the financial statement is dated. This may not be consistent with full year annual report figures.
Have feedback on this article? Concerned about the content? Get in touch with us directly. Alternatively, email editorial-team (at) simplywallst.com.
This article by Simply Wall St is general in nature. We provide commentary based on historical data and analyst forecasts only using an unbiased methodology and our articles are not intended to be financial advice. It does not constitute a recommendation to buy or sell any stock, and does not take account of your objectives, or your financial situation. We aim to bring you long-term focused analysis driven by fundamental data. Note that our analysis may not factor in the latest price-sensitive company announcements or qualitative material. Simply Wall St has no position in any stocks mentioned.
