Here's What Estia Health Limited's (ASX:EHE) P/E Ratio Is Telling Us

This article is written for those who want to get better at using price to earnings ratios (P/E ratios). We'll apply a basic P/E ratio analysis to Estia Health Limited's (ASX:EHE), to help you decide if the stock is worth further research. Based on the last twelve months, Estia Health's P/E ratio is 13.95. That corresponds to an earnings yield of approximately 7.2%.
See our latest analysis for Estia Health
How Do I Calculate A Price To Earnings Ratio?
The formula for P/E is:
Price to Earnings Ratio = Share Price ÷ Earnings per Share (EPS)
Or for Estia Health:
P/E of 13.95 = AUD2.21 ÷ AUD0.16 (Based on the year to December 2019.)
Is A High Price-to-Earnings Ratio Good?
A higher P/E ratio means that buyers have to pay a higher price for each AUD1 the company has earned over the last year. All else being equal, it's better to pay a low price -- but as Warren Buffett said, 'It's far better to buy a wonderful company at a fair price than a fair company at a wonderful price'.
Does Estia Health Have A Relatively High Or Low P/E For Its Industry?
The P/E ratio indicates whether the market has higher or lower expectations of a company. The image below shows that Estia Health has a lower P/E than the average (19.7) P/E for companies in the healthcare industry.
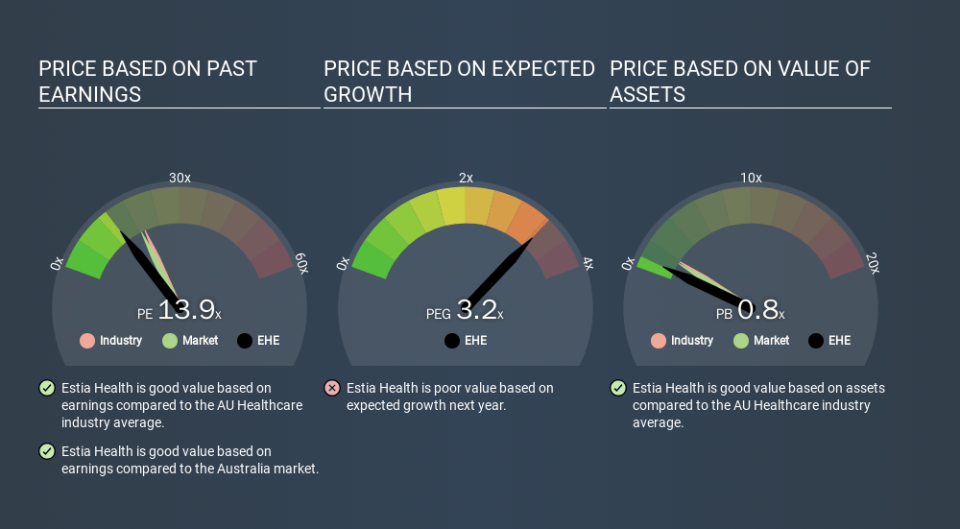
Estia Health's P/E tells us that market participants think it will not fare as well as its peers in the same industry. Since the market seems unimpressed with Estia Health, it's quite possible it could surprise on the upside. It is arguably worth checking if insiders are buying shares, because that might imply they believe the stock is undervalued.
How Growth Rates Impact P/E Ratios
Companies that shrink earnings per share quickly will rapidly decrease the 'E' in the equation. That means unless the share price falls, the P/E will increase in a few years. Then, a higher P/E might scare off shareholders, pushing the share price down.
Estia Health maintained roughly steady earnings over the last twelve months.
Remember: P/E Ratios Don't Consider The Balance Sheet
The 'Price' in P/E reflects the market capitalization of the company. Thus, the metric does not reflect cash or debt held by the company. Theoretically, a business can improve its earnings (and produce a lower P/E in the future) by investing in growth. That means taking on debt (or spending its cash).
Such expenditure might be good or bad, in the long term, but the point here is that the balance sheet is not reflected by this ratio.
Is Debt Impacting Estia Health's P/E?
Estia Health's net debt is 16% of its market cap. It would probably deserve a higher P/E ratio if it was net cash, since it would have more options for growth.
The Bottom Line On Estia Health's P/E Ratio
Estia Health trades on a P/E ratio of 13.9, which is below the AU market average of 18.6. The company hasn't stretched its balance sheet, and earnings are improving. The P/E ratio implies the market is cautious about longer term prospects.
Investors have an opportunity when market expectations about a stock are wrong. As value investor Benjamin Graham famously said, 'In the short run, the market is a voting machine but in the long run, it is a weighing machine. So this free report on the analyst consensus forecasts could help you make a master move on this stock.
Of course, you might find a fantastic investment by looking at a few good candidates. So take a peek at this free list of companies with modest (or no) debt, trading on a P/E below 20.
If you spot an error that warrants correction, please contact the editor at editorial-team@simplywallst.com. This article by Simply Wall St is general in nature. It does not constitute a recommendation to buy or sell any stock, and does not take account of your objectives, or your financial situation. Simply Wall St has no position in the stocks mentioned.
We aim to bring you long-term focused research analysis driven by fundamental data. Note that our analysis may not factor in the latest price-sensitive company announcements or qualitative material. Thank you for reading.
